G2-mobile
图表示例
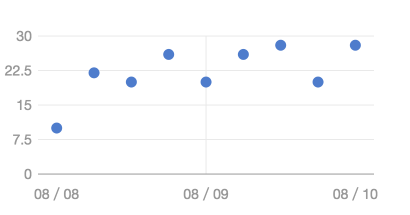
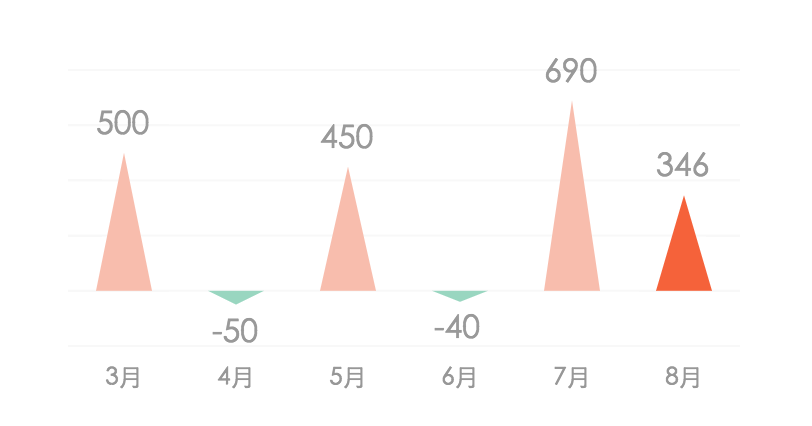
点图
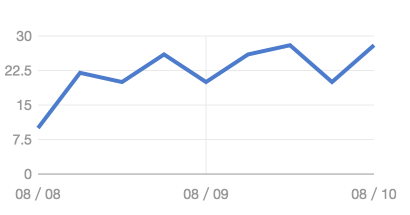
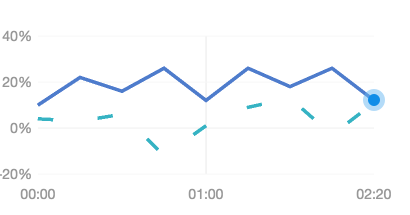
线图
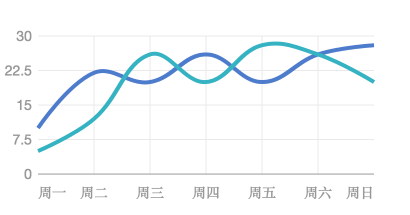
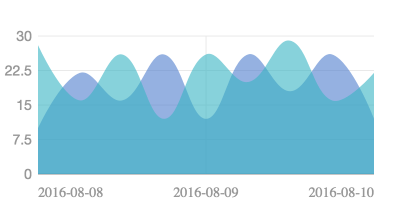
区域图
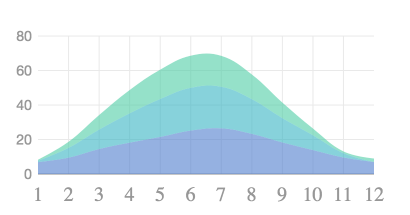
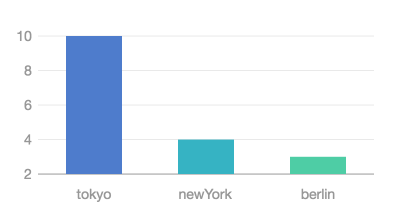
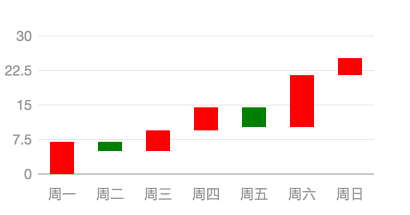
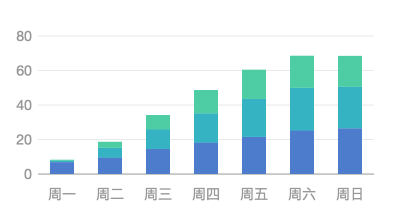
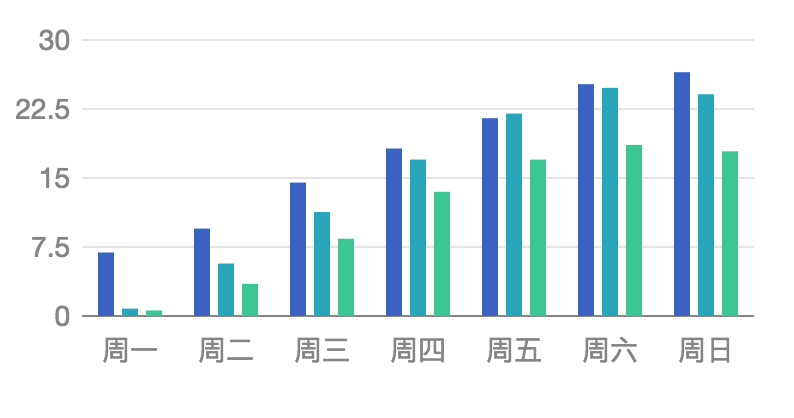
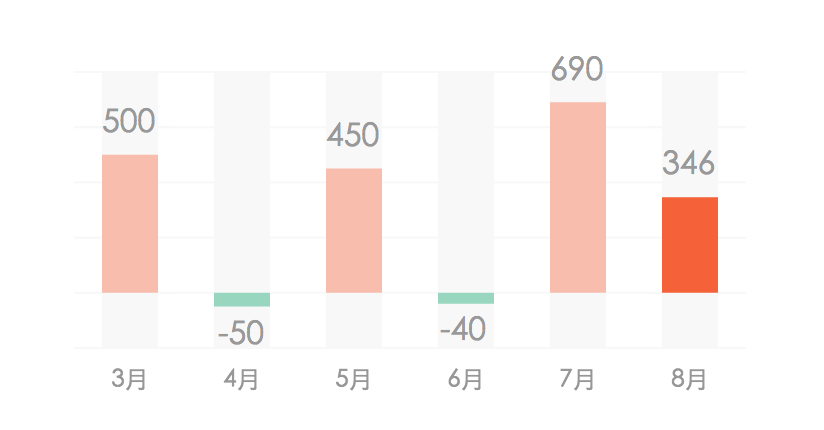
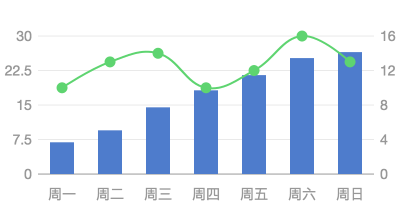
柱状图
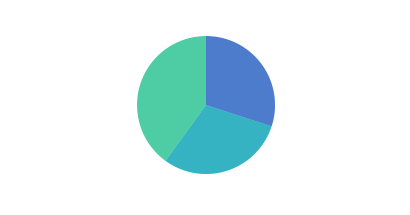
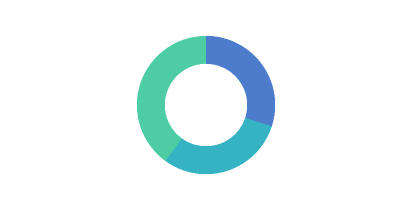
饼图
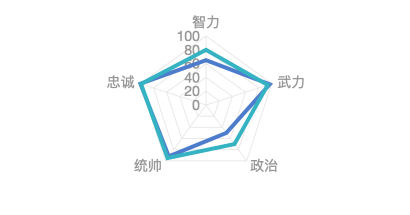
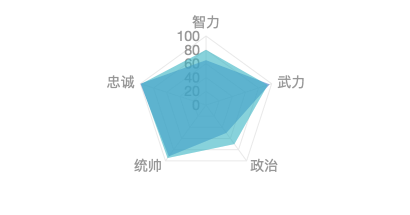
雷达图
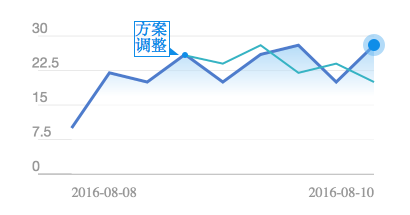
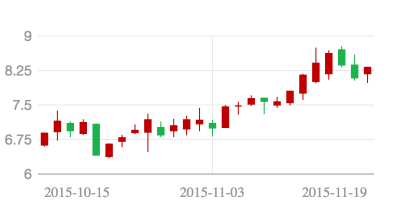
股票图
其他图表
源码
运行
复制
<!DOCTYPE html> <html> <head> <meta charset="utf-8"> <title>饼图</title> <script src="https://a.alipayobjects.com/g/datavis/g2-mobile-all/2.1.22/index.js"></script> </head> <body> <div style="width:416px;height:218px;margin:0 auto"> <canvas id="c1" style="width:416px;height:218px;"></canvas> </div> <script> GM.Global.pixelRatio = 2; var data = [ {a: '1', b: 0.3, c: '1'}, {a: '1', b: 0.3, c: '2'}, {a: '1', b: 0.4, c: '3'} ]; var chart = new GM.Chart({ id: 'c1' }); chart.source(data); chart.coord('polar', { transposed: true, inner: 0 }); chart.axis(false); chart.intervalStack().position('a*b').color('c'); chart.render(); </script> </body> </html>
饼图
饼图广泛得应用在各个领域,用于表示不同分类的占比情况,通过弧度大小来对比各种分类。
了解更多
<!DOCTYPE html> <html> <head> <meta charset="utf-8"> <title>饼图</title> <script src="https://unpkg.com/react@15/dist/react.min.js"></script> <script src="https://unpkg.com/react-dom@15/dist/react-dom.min.js"></script> <script src="https://a.alipayobjects.com/g/datavis/g2/2.3.13/g2.js"></script> <script src="https://unpkg.com/g2-react@1.2.0/dist/index.js"></script> <script src="https://cdn.bootcss.com/babel-core/5.8.38/browser.min.js"></script> <script src="https://unpkg.com/axios/dist/axios.min.js"></script> </head> <body> <script type="text/babel">undefined </body> </html>