G2-mobile
图表示例
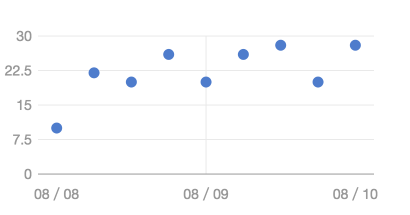
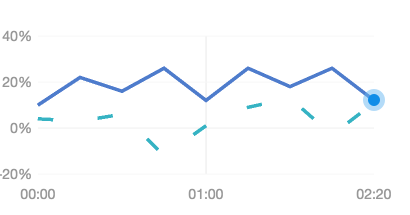
点图
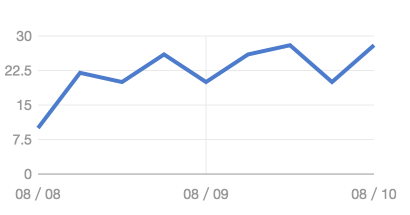
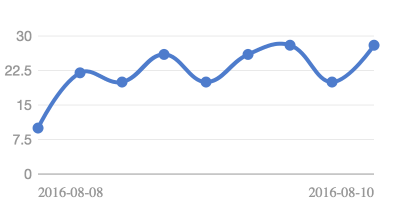
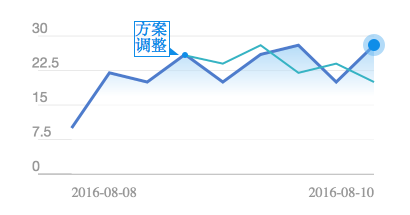
线图
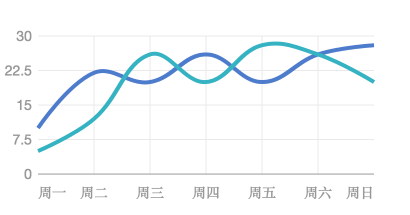
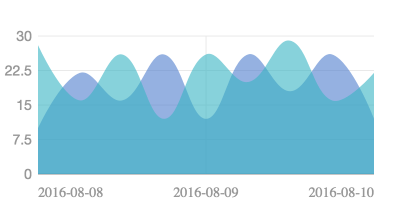
区域图
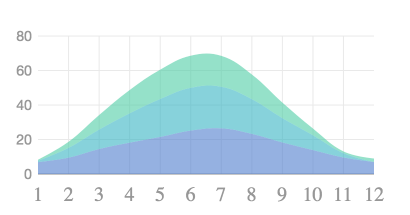
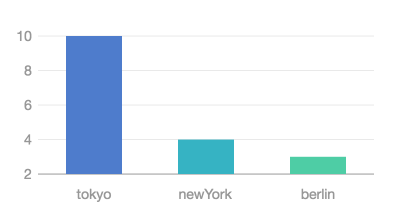
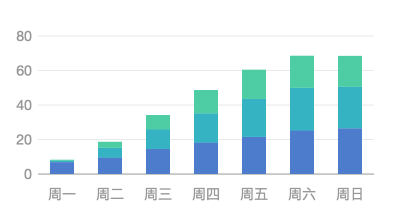
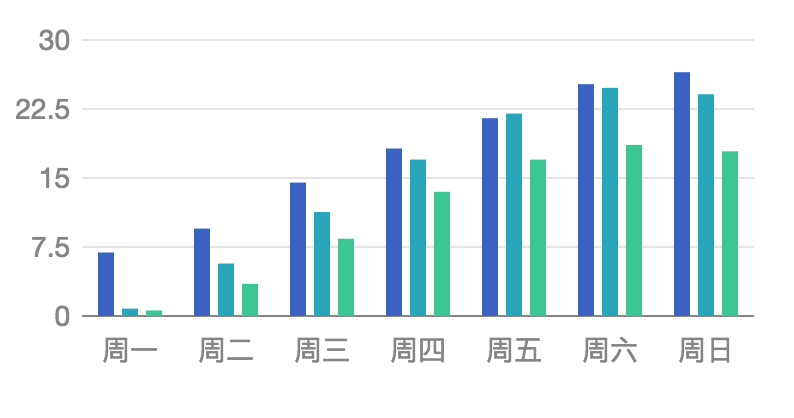
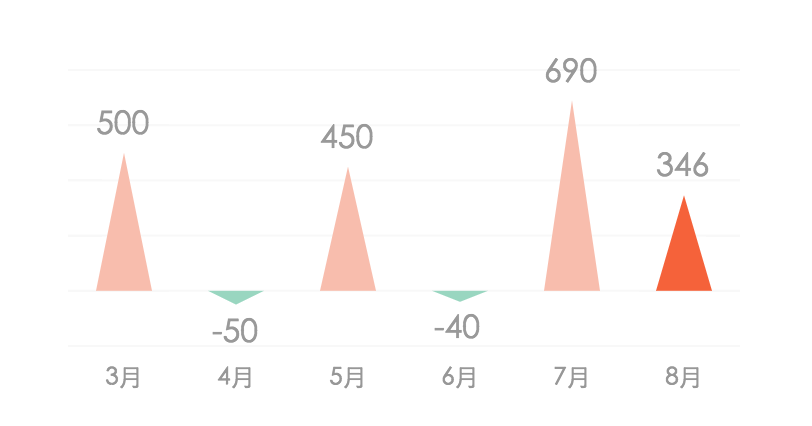
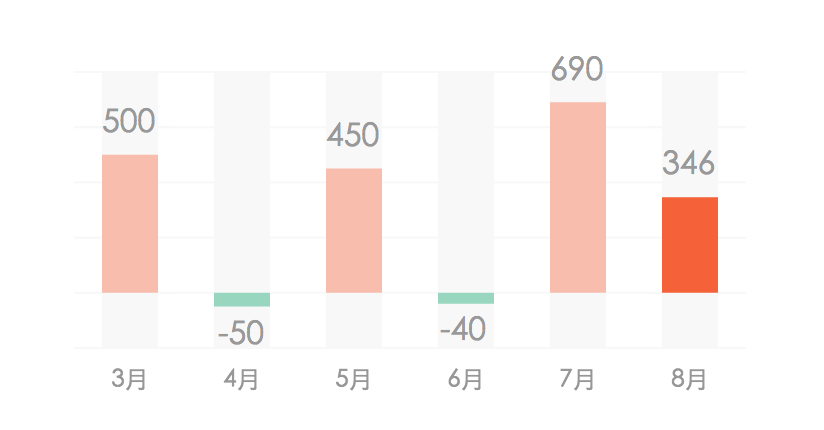
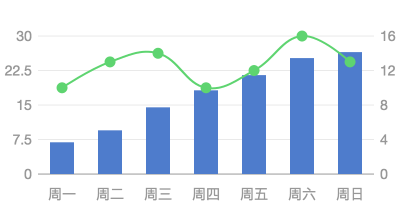
柱状图
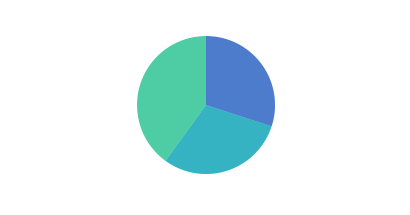
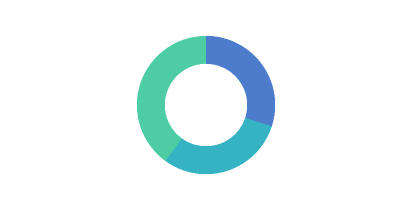
饼图
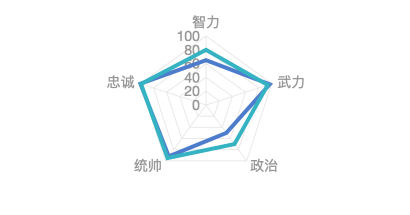
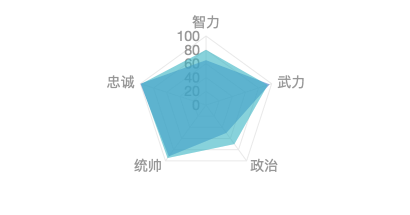
雷达图
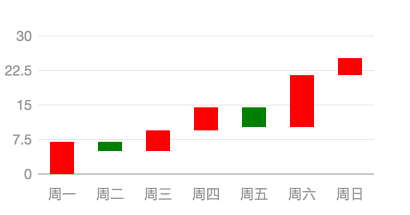
股票图
其他图表
源码
运行
复制
<!DOCTYPE html> <html> <head> <meta charset="utf-8"> <title>股票图</title> <script src="https://a.alipayobjects.com/g/datavis/g2-mobile-all/2.1.22/index.js"></script> </head> <body> <div style="width:416px;height:218px;margin:0 auto"> <canvas id="c1" style="width:416px;height:218px;"></canvas> </div> <script src="/static/jquery.js"></script> <script> var Util = GM.Util; GM.Global.pixelRatio = 2; //获取本地数据 $.getJSON('../../../static/data/mobileCandleSticks.json',function(data){ //数据处理 data.sort(function(obj1, obj2){ return obj1.time > obj2.time ? 1 : -1; }); data.forEach(function(obj) { obj.range = [obj.start, obj.end, obj.max, obj.min]; obj.trend = (obj.start <= obj.end) ? 0 : 1; }); var chart = new GM.Chart({ id: 'c1' }); //配置刻度文字大小,供PC端显示用(移动端可以使用默认值20px) chart.axis('range', { label: { fontSize: 14 } }); //配置time刻度文字样式 var label = { fill: '#979797', font: '14px san-serif', offset: 6 }; chart.axis('time', { label: function (text, index, total) { var cfg = Util.mix({}, label); // 第一个点左对齐,最后一个点右对齐,其余居中,只有一个点时左对齐 if (index === 0) { cfg.textAlign = 'start'; } if (index > 0 && index === total - 1) { cfg.textAlign = 'end'; } return cfg; } }); chart.source(data, { range: { tickCount: 5 }, time: { tickCount: 3 } }); chart.schema().position('time*range') .color('trend', function(trend){ return ['#C00000','#19B24B'][trend]; }) .shape('candle'); chart.render(); }); </script> </body> </html>
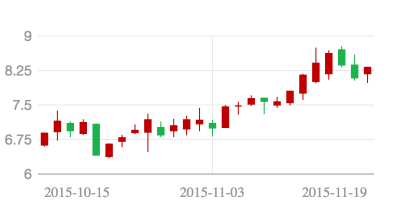
股票图
K 线图,原名蜡烛图,又称阴阳图、棒线、红黑线或蜡烛线,常用于展示股票交易数据。
了解更多
<!DOCTYPE html> <html> <head> <meta charset="utf-8"> <title>股票图</title> <script src="https://unpkg.com/react@15/dist/react.min.js"></script> <script src="https://unpkg.com/react-dom@15/dist/react-dom.min.js"></script> <script src="https://a.alipayobjects.com/g/datavis/g2/2.3.13/g2.js"></script> <script src="https://unpkg.com/g2-react@1.2.0/dist/index.js"></script> <script src="https://cdn.bootcss.com/babel-core/5.8.38/browser.min.js"></script> <script src="https://unpkg.com/axios/dist/axios.min.js"></script> </head> <body> <script type="text/babel">undefined </body> </html>