折线图
折线图的简介

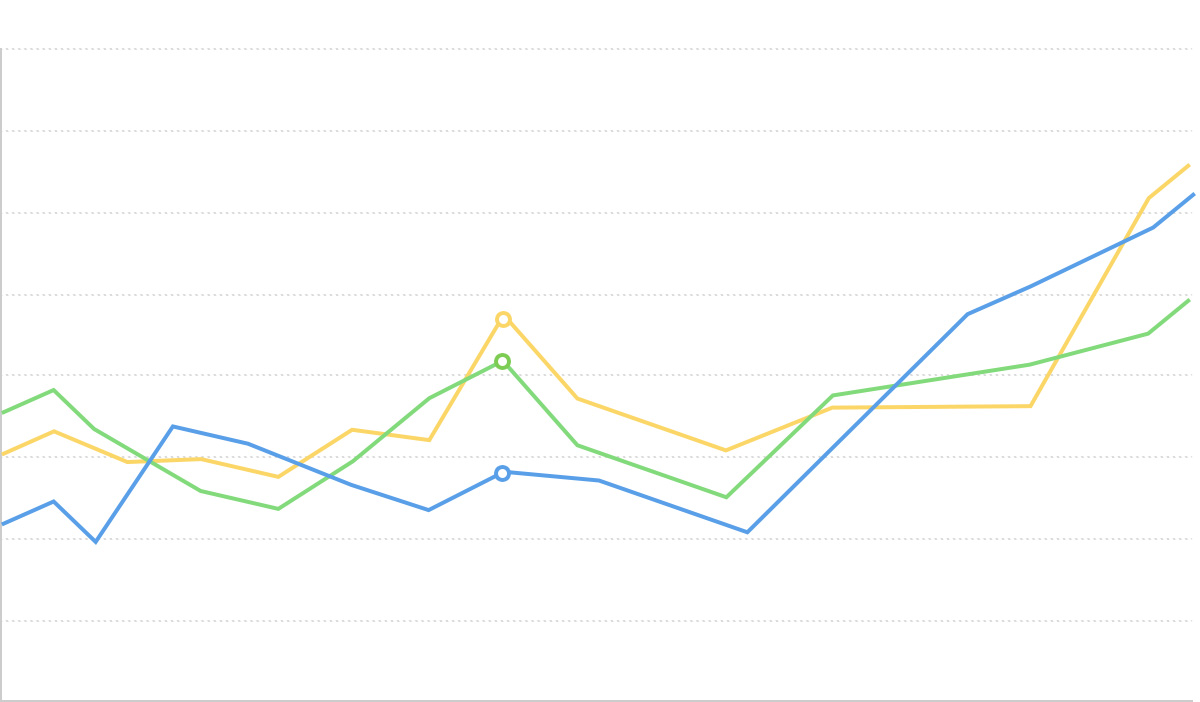
折线图用于显示数据在一个连续的时间间隔或者时间跨度上的变化,它的特点是反映事物随时间或有序类别而变化的趋势。
在折线图中,数据是递增还是递减、增减的速率、增减的规律(周期性、螺旋性等)、峰值等特征都可以清晰地反映出来。所以,折线图常用来分析数据随时间的变化趋势,也可用来分析多组数据随时间变化的相互作用和相互影响。例如可用来分析某类商品或是某几类相关的商品随时间变化的销售情况,从而进一步预测未来的销售情况。在折线图中,一般水平轴(X轴)用来表示时间的推移,并且间隔相同;而垂直轴(Y轴)代表不同时刻的数据的大小。
英文名:Line chart
折线图的构成

| 图表类型 |
折线图 |
| 适合的数据 |
两个连续字段数据,或者一个有序的分类一个连续数据字段 |
| 功能 |
观察数据的变化趋势 |
| 数据与图形的映射 |
两个连续字段分别映射到横轴和纵轴
|
| 适合的数据条数 |
单条线的数据记录数要大于2,但是同一个图上不要超过5条折线 |
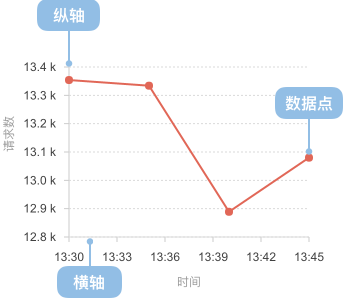
一个折线图的构成包括:
- 横轴:表示时间
- 纵轴:表示数值
- 点:表示各个数据的位置
- 线:连接各个数据点
折线图的应用场景
适合的场景
例子1:有序的因变量,比如:时间。
下图是某监控系统的折线图表,显示了请求次数和响应时间随时间的变化趋势。
横轴表示时间,因为需要同时展示请求次数和响应时间这两组数据,所以添加了两个垂直坐标轴。折线图可以很好地表现数据递减、增减的速率、增减的规律、峰值等特征。
| time(时间) |
requestCount(请求次数) |
avgRt(响应时间) |
| 9:00 |
32215.0 |
45207.51 |
| 9:05 |
29422.0 |
32978.0 |
| ... |
... |
... |
$.getJSON('./data/system.json?nowrap',function (data) {
var Stat = G2.Stat;
var chart = new G2.Chart({
id: 'c2',
forceFit: true,
height : 400
});
chart.source(data);
chart.legend({position: 'top'});
chart.col('timeStamp', {alias: '时间',type: 'time', mask: 'HH:MM', nice: false, tickCount:8});
chart.col('requestCount', {
alias: '执行次数',
formatter: function(val) {
return val/1000 + 'k';
}
});
chart.col('avgRt', {
alias: '响应时间',
formatter: function(val) {
return val/1000 + 's';
}
});
chart.axis('avgRt', {
titleOffset: 135
});
chart.line().position(Stat.summary.mean('timeStamp*requestCount')).size(3);
chart.line().position(Stat.summary.mean('timeStamp*avgRt')).color('#E47668').size(3);
chart.render();
});
例子2:不同月份的温度
| month |
temperature |
| Jan |
7.0 |
| Feb |
6.9 |
| Mar |
9.5 |
| 。。。 |
。。。 |
var data = [
{month: 'Jan', temperature: 7.0},
{month: 'Feb', temperature: 6.9},
{month: 'Mar', temperature: 9.5},
{month: 'Apr', temperature: 14.5},
{month: 'May', temperature: 18.2},
{month: 'Jun', temperature: 21.5},
{month: 'Jul', temperature: 25.2},
{month: 'Aug', temperature: 26.5},
{month: 'Sep', temperature: 23.3},
{month: 'Oct', temperature: 18.3},
{month: 'Nov', temperature: 13.9},
{month: 'Dec', temperature: 9.6}
];
var chart = new G2.Chart({
id: 'c2.1',
forceFit: true,
height: 400
});
chart.source(data, {
month: {
alias: '月份',
range: [0, 1]
},
temperature: {
alias: '平均温度(°C)'
}
});
chart.line().position('month*temperature').size(2);
chart.render();
注意:
- month:月份是有序的分类,映射到
位置来区分不同的月份
- temperature: 是连续的数据值,映射到
位置来对比不同的月份的温度
不适合的场景
当水平轴的数据类型为无序的分类或者垂直轴的数据类型为连续时间时,不适合使用折线图。
我们以一个不同游戏类型的销量对比的场景为例,对于表示分类对比的数据时,我们更应该使用柱状图,而不是折线图。
var data = [
{genre:'Sports',sold:27500},
{genre:'Strategy',sold:11500},
{genre:'Action',sold:6000},
{genre:'Shooter',sold:3500},
{genre:'Other',sold:1500},
];
var Stat = G2.Stat;
var chart = new G2.Chart({
id: 'c3',
forceFit: true,
height : 250,
plotCfg: {
margin: [15, 80, 60, 80]
}
});
chart.source(data);
chart.col('sold', {
alias: '销售量',
formatter: function(val) {
return (val / 1000) + 'k';
}
});
chart.col('genre', {
alias: '游戏类型'
});
chart.line().position('genre*sold').size(3);
chart.render();
var chart1 = new G2.Chart({
id: 'c4',
forceFit: true,
height : 250,
plotCfg: {
margin: [15, 80, 60, 80]
}
});
chart1.source(data);
chart1.col('sold', {
alias: '销售量',
formatter: function(val) {
return (val / 1000) + 'k';
}
});
chart1.col('genre', {
alias: '游戏类型'
});
chart1.interval().position('genre*sold').color('genre');
chart1.render();
当折线的条数过多时不建议将多条线绘制在一张图上,下图展示了多台机器(实例)的资源占用情况
$.getJSON('./data/monitor.json?nowrap', function(data) {
var Stat = G2.Stat;
var chart = new G2.Chart({
id: 'c5',
forceFit: true,
height : 400,
animate: false,
plotCfg: {
margin: [15, 110, 60, 80]
}
});
chart.source(data, {
time: {
type: 'time',
alias: '时间',
mask: 'mm-dd HH'
},
type: {
alias: '实例'
}
});
chart.line().position('time*value').color('type');
chart.render();
});
注意:
- 如果业务目的是查看某台机器(实例)异常(区别于其他机器的资源占用)时,这个图可以满足需求
- 如果业务目的是查看具体的某台机器的资源占用时,这个图很难看清楚,不建议同时显示多条折线,可以控制仅显示一条线来解决这个问题
$.getJSON('./data/monitor.json?nowrap', function(data) {
var Stat = G2.Stat;
var chart = new G2.Chart({
id: 'c6',
forceFit: true,
height : 400,
animate: false,
plotCfg: {
margin: [15, 110, 60, 80]
}
});
chart.source(data, {
time: {
type: 'time',
alias: '时间',
mask: 'mm-dd HH'
},
type: {
alias: '实例'
}
});
chart.legend({
selectedMode: 'single'
});
chart.filter('type', [data[0].type]);
chart.line().position('time*value').color('type');
chart.render();
});
折线图的扩展
为了视觉的美观可以将折线转换成平滑曲线
var data = [
{month: 'Jan', temperature: 7.0},
{month: 'Feb', temperature: 6.9},
{month: 'Mar', temperature: 9.5},
{month: 'Apr', temperature: 14.5},
{month: 'May', temperature: 18.2},
{month: 'Jun', temperature: 21.5},
{month: 'Jul', temperature: 25.2},
{month: 'Aug', temperature: 26.5},
{month: 'Sep', temperature: 23.3},
{month: 'Oct', temperature: 18.3},
{month: 'Nov', temperature: 13.9},
{month: 'Dec', temperature: 9.6}
];
var chart = new G2.Chart({
id: 'c7',
forceFit: true,
height: 400
});
chart.source(data, {
month: {
alias: '月份',
range: [0, 1]
},
temperature: {
alias: '平均温度(°C)'
}
});
chart.line().position('month*temperature').size(2).shape('smooth');
chart.render();
折线图与其他图表的对比
- 柱状图主要用于多个分类间的数据(大小、数量)的对比,折线图主要用于时间或者连续数据上的趋势。
- 分类间的数据比较,如果分类不存在顺序,那么不要使用折线图。
- 折线图和面积图都可以表示一段时间(或者有序分类)的趋势,相比之下面积图的表现力更强一些
- 面积图还可以表示数据的上下限,例如可以表示温度的最小值、最大值
变型
标签

