课程 5 - 绘制网格
在这节课中你将学习到以下内容:
- 绘制直线网格。使用 Line Geometry 或者屏幕空间技术。
- 绘制点网格。
$button = call(() => {
    const $button = document.createElement('button');
    $button.textContent = 'FlyTo origin';
    return $button;
});checkboardStyle = Inputs.radio(['none', 'grid', 'dots'], {
label: 'Checkboard Style',
value: 'grid',
});canvas = call(() => {
const { Canvas } = Lesson5;
return Utils.createCanvas(Canvas, 400, 400);
});call(() => {
const styles = ['none', 'grid', 'dots'];
canvas.setCheckboardStyle(styles.indexOf(checkboardStyle));
});(async () => {
const { Canvas, Circle, Group } = Lesson5;
const solarSystem = new Group();
const earthOrbit = new Group();
const moonOrbit = new Group();
const sun = new Circle({
cx: 0,
cy: 0,
r: 100,
fill: 'red',
});
const earth = new Circle({
cx: 0,
cy: 0,
r: 50,
fill: 'blue',
});
const moon = new Circle({
cx: 0,
cy: 0,
r: 25,
fill: 'yellow',
});
solarSystem.appendChild(sun);
solarSystem.appendChild(earthOrbit);
earthOrbit.appendChild(earth);
earthOrbit.appendChild(moonOrbit);
moonOrbit.appendChild(moon);
solarSystem.position.x = 200;
solarSystem.position.y = 200;
earthOrbit.position.x = 100;
moonOrbit.position.x = 100;
canvas.appendChild(solarSystem);
let id;
const animate = () => {
solarSystem.rotation += 0.01;
earthOrbit.rotation += 0.02;
canvas.render();
id = requestAnimationFrame(animate);
};
animate();
unsubscribe(() => {
cancelAnimationFrame(id);
canvas.destroy();
});
const landmark = canvas.camera.createLandmark({
x: 0,
y: 0,
zoom: 1,
rotation: 0,
});
$button.onclick = () => {
canvas.camera.gotoLandmark(landmark, {
duration: 1000,
easing: 'ease',
});
};
return canvas.getDOM();
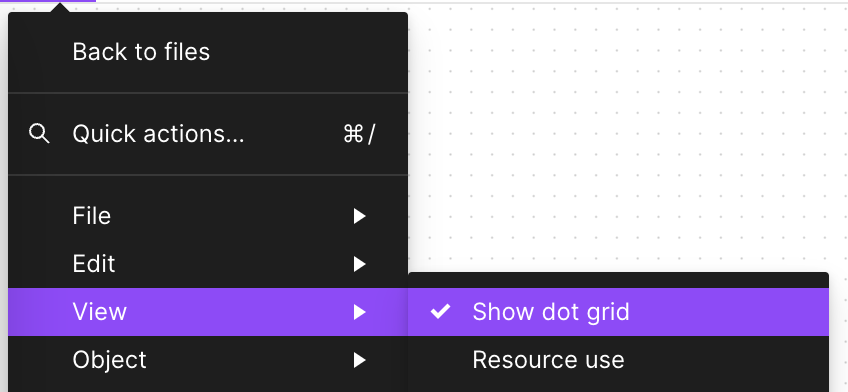
})();在 Figma 和 FigJam 中,缩放到一定大小时会出现网格,前者是直线而后者是点状。

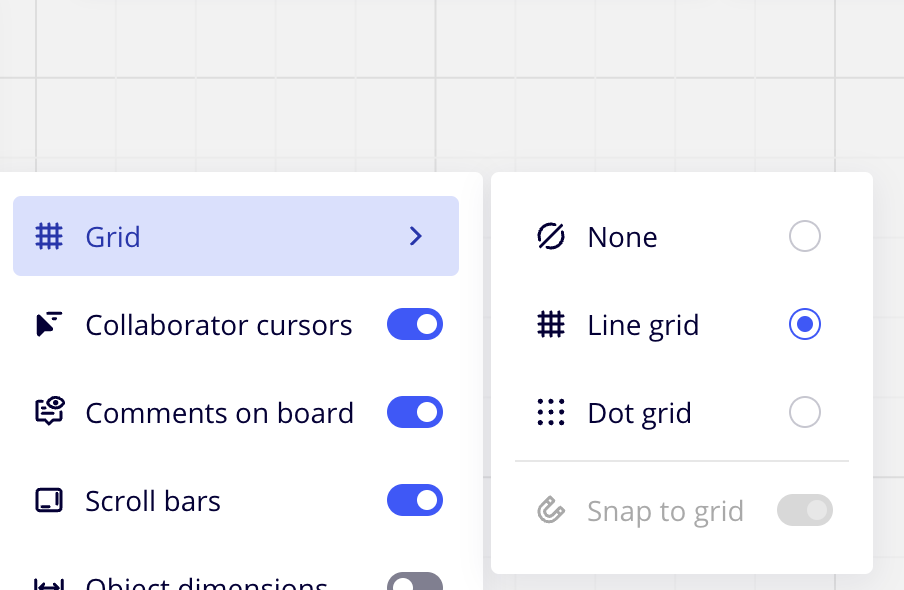
Miro 则支持在直线和点之间进行切换:

我们先来实现直线网格。
直线网格
首先网格不应该是场景图的一部分,我们不希望缩放画布时网格也跟着变大变小,但同时也要在缩放时拥有淡入淡出效果。因此我们在 beginFrame 钩子中首先渲染网格,将场景所需的信息例如相机也传递进去:
hooks.initAsync.tapPromise(async () => {
    this.#grid = new Grid();
});
hooks.beginFrame.tap(() => {
    this.#grid.render(
        this.#device,
        this.#renderPass,
        this.#uniformBuffer,
        camera,
    );
});
Line Geometry
最容易想到的思路是类似 GridHelper - Three.js 这样,根据网格尺寸创建一组线段:
// https://github.com/mrdoob/three.js/blob/master/src/helpers/GridHelper.js#L25-L37
for (var i = 0, j = 0, k = -halfSize; i <= divisions; i++, k += step) {
    vertices.push(-halfSize, 0, k, halfSize, 0, k);
    vertices.push(k, 0, -halfSize, k, 0, halfSize);
}

var geometry = new BufferGeometry();
geometry.addAttribute('position', new Float32BufferAttribute(vertices, 3));
geometry.addAttribute('color', new Float32BufferAttribute(colors, 3));

var material = new LineBasicMaterial({ vertexColors: VertexColors });
LineSegments.call(this, geometry, material);
Figma CTO Evan 的 thetamath 项目中也是这么实现的,从水平和垂直两个方向构建网格所需的线段:
for (let x = left; x < right; x++) {
    const tx = ox + (x * zoom) / step;
    this.strokeLine();
}
for (let y = top; y < bottom; y++) {
    const ty = oy - (y * zoom) / step;
    this.strokeLine();
}
如何在 WebGL 中绘制直线呢?之前我写过一篇 在 WebGL 中绘制直线,简而言之如果不考虑接头,只需要沿法线方向向两侧拉伸,使用两个三角形绘制:
thetamath 还使用了两个小技巧,首先是使用 Triangle strip,相比常规的 Triangle 能节省顶点,从 3N 减少到 N + 2,其中 N 为三角形数目:
this.#pipeline = device.createRenderPipeline({
    inputLayout: this.#inputLayout,
    program: this.#program,
    colorAttachmentFormats: [Format.U8_RGBA_RT],
    topology: PrimitiveTopology.TRIANGLE_STRIP,
});
其次是将颜色存储在四个 Byte 中:
255 | (255 << 8) | (255 << 16) | (127 << 24);配合 vertexAttribPointer 声明每个分量都是 gl.UNSIGNED_BYTE 并且需要归一化:
this.#inputLayout = device.createInputLayout({
  vertexBufferDescriptors: [
    {
      arrayStride: 4 * 5,
      stepMode: VertexStepMode.VERTEX,
      attributes: [
        {
          format: Format.F32_RGBA,
          offset: 0,
          shaderLocation: 0,
        },
        {
          format: Format.U8_RGBA_NORM,
          offset: 4 * 4,
          shaderLocation: 1,
        },
      ],
    },
  ],
  indexBufferFormat: null,
  program: this.#program,
});
看看效果:
(async () => {
    const { Canvas, Circle, Group } = Lesson5;
    const [$canvas, canvas] = await Utils.createCanvas(Canvas, 400, 400);

    canvas.setGridImplementation(0);

    const solarSystem = new Group();
    const earthOrbit = new Group();
    const moonOrbit = new Group();

    const sun = new Circle({
        cx: 0,
        cy: 0,
        r: 100,
        fill: 'red',
    });
    const earth = new Circle({
        cx: 0,
        cy: 0,
        r: 50,
        fill: 'blue',
    });
    const moon = new Circle({
        cx: 0,
        cy: 0,
        r: 25,
        fill: 'yellow',
    });
    solarSystem.appendChild(sun);
    solarSystem.appendChild(earthOrbit);
    earthOrbit.appendChild(earth);
    earthOrbit.appendChild(moonOrbit);
    moonOrbit.appendChild(moon);

    solarSystem.position.x = 200;
    solarSystem.position.y = 200;
    earthOrbit.position.x = 100;
    moonOrbit.position.x = 100;

    canvas.appendChild(solarSystem);

    let id;
    const animate = () => {
        solarSystem.rotation += 0.01;
        earthOrbit.rotation += 0.02;
        canvas.render();
        id = requestAnimationFrame(animate);
    };
    animate();

    unsubscribe(() => {
        cancelAnimationFrame(id);
        canvas.destroy();
    });

    return $canvas;
})();
在这种方法中,画布尺寸越大、网格密度越高所需的顶点就越多,有没有办法使用更少的顶点实现呢?既然网格永远填充整个屏幕,那是否可以在屏幕空间完成呢?
Fragment Shader
正如 Building Flexible and Powerful Cross-Sections with GridPaper and WebGL 一文所说:
Instead of rendering all these lines as geometry, we can use a WebGL fragment shader to generate the lines on a per-pixel basis.
在屏幕空间实现的好处是只需要一个充满屏幕的 Quad 就行了,顶点只需要四个,传入裁剪坐标系下的坐标。当然使用一个全屏幕三角形也可以,而且只需要三个顶点,这在后处理中很常见:
this.appendVertex(-1, -1);
this.appendVertex(-1, 1);
this.appendVertex(1, -1);
this.appendVertex(1, 1);
这样在 Vertex Shader 中可以无需变换直接使用:
layout(location = 0) in vec4 a_Position;
void main() {
  gl_Position = vec4(a_Position.xy, 0, 1);
}
后续在 Fragment Shader 中绘制网格需要使用像素点在世界坐标系下的坐标。因此通过相机投影变换矩阵的逆矩阵,将裁剪坐标系下的坐标转换到世界坐标系下:
layout(std140) uniform SceneUniforms {
  mat3 u_ProjectionMatrix;
  mat3 u_ViewMatrix;
  mat3 u_ViewProjectionInvMatrix;
};

out vec2 v_Position;

vec2 project_clipspace_to_world(vec2 p) {
  return (u_ViewProjectionInvMatrix * vec3(p, 1.0)).xy;
}

void main() {
  v_Position = project_clipspace_to_world(a_Position.xy);
}
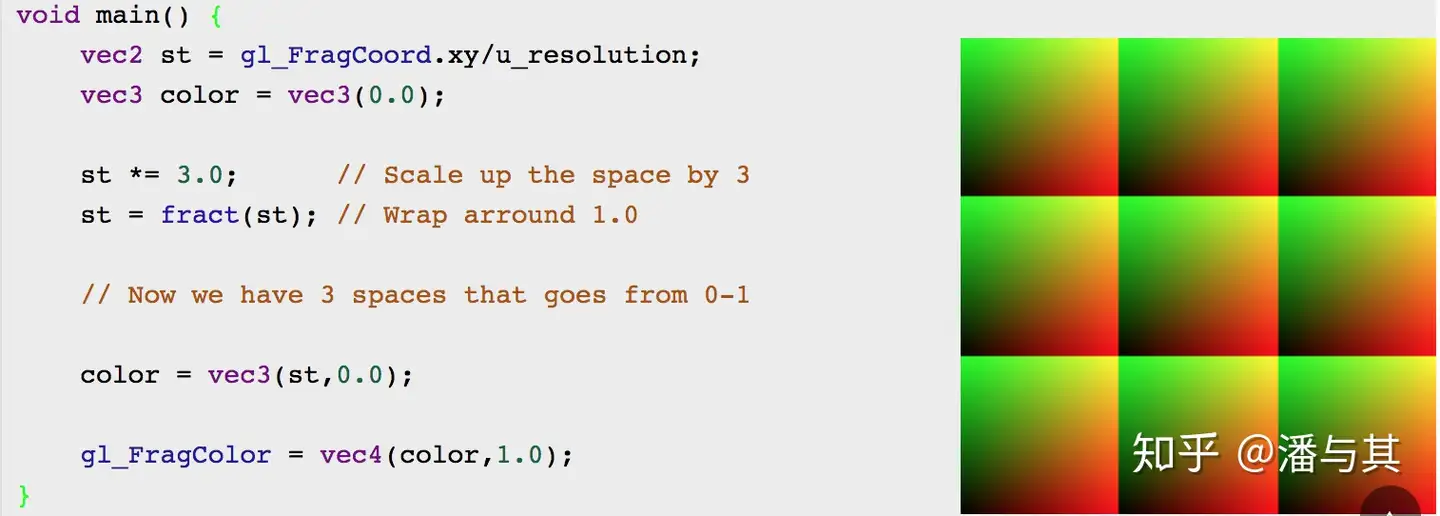
在 Canvas2D 和 SVG 中网格通常使用 Pattern 实现。在 Fragment Shader 中实现的基本思路也很类似,使用内置函数 fract 绘制 Pattern,将初始坐标空间放大到 n 倍,然后通过 fract 取得小数部分。这样后续只需要考虑坐标范围在 0-1 的小块即可,详见 the book of shaders - Patterns:

还是来自 Figma CTO Evan 的文章:Anti-Aliased Grid Shader
vec4 render_grid_checkerboard(vec2 coord) {
  // Compute anti-aliased world-space grid lines
  vec2 grid = abs(fract(coord / gridSize - 0.5) - 0.5) / fwidth(coord) * gridSize;
  float line = min(grid.x, grid.y);
  float alpha = 1.0 - min(line, 1.0);
}
我们希望绘制两套粗细网格,其中细网格的间隔是粗网格的 1/5,同时检测当前像素点是否更靠近粗网格:
vec2 size = scale_grid_size(u_ZoomScale);
float gridSize1 = size.x;
float gridSize2 = gridSize1 / 5.0;
圆点网格
对于圆点网格,我们依旧选择在 Fragment Shader 屏幕空间中处理。当然也可以使用之前介绍过的 SDF 绘制圆的方式,但这样就需要大量顶点了。因此继续复用直线网格的 Pattern,只是这里使用 SDF 判断像素点是否在圆内,我们在第二节课中已经介绍过该方法了:
vec2 grid2 = abs(fract(coord / gridSize2 - 0.5) - 0.5) / fwidth(coord) * gridSize2;
alpha = smoothstep(1.0, 0.0, length(grid2) - BASE_DOT_SIZE * u_ZoomScale / zoomStep);
为了支持在直线、圆点网格间切换,我们增加一个新的 Uniform 用来区分不同的网格样式:
layout(std140) uniform SceneUniforms {
  mat3 u_ProjectionMatrix;
  mat3 u_ViewMatrix;
  mat3 u_ViewProjectionInvMatrix;
  float u_ZoomScale;
  float u_CheckboardStyle;
};
这样在 Fragment Shader 中就可以根据这个变量绘制不同类型的网格了:
const int CHECKERBOARD_STYLE_NONE = 0;
const int CHECKERBOARD_STYLE_GRID = 1;
const int CHECKERBOARD_STYLE_DOTS = 2;

vec4 render_grid_checkerboard(vec2 coord) {
  int checkboardStyle = int(floor(u_CheckboardStyle + 0.5));
  if (checkboardStyle == CHECKERBOARD_STYLE_GRID) {
    // 直线网格
  } else if (checkboardStyle == CHECKERBOARD_STYLE_DOTS) {
    // 圆点网格
  }
}
可以回到页面开头的例子,在不同网格间进行切换。
调整亮度
在 Figma / FigJam 的 Shader 中,还计算了颜色的亮度,并根据亮度值对颜色进行调整。具体来说,它使用了一种基于亮度的颜色调整算法,旨在改善颜色的视觉效果,使得在亮度较高的背景下文字或图形更加清晰可见。
定义了一个权重向量 weights,这些权重是根据人眼对不同颜色亮度感知的非线性特性而设定的,通常用于计算 RGB 颜色空间中的亮度值。
vec3 gridColor; // 存储最终调整后的颜色值
vec3 weights = vec3(0.299, 0.587, 0.114);
float c2 = dot(rgb * rgb, weights); // 计算了RGB颜色值的加权平方和,这个值c2是颜色亮度的一个估计值
float luminance = sqrt(c2);
如果亮度值大于 0.5,说明颜色本身已经比较亮,代码会计算一个调整因子 target,并用它来调整颜色值 rgb,使得颜色变得更暗一些,从而在亮背景下更易于观察。如果亮度值不大于 0.5,说明颜色本身比较暗,代码会采取另一种策略来调整颜色。首先计算一个新的亮度目标值target,然后使用 mix 函数结合 rgb 颜色和纯白色 vec3(1),根据 b 和 a 的计算结果来决定最终的颜色混合比例。这里 a 和 b 是根据原始颜色的亮度值计算得到的,用于控制颜色调整的过程。
if (luminance > 0.5) {
    float target = (luminance - 0.05) / luminance;
    gridColor = rgb * target;
}
else {
    float target = luminance * 0.8 + 0.15;
    float c1 = dot(rgb, weights);
    float a = 1.0 - 2.0 * c1 + c2;
    float b = c2 - c1;
    gridColor = mix(rgb, vec3(1), (b + sqrt(b * b - a * (c2 - target * target))) / a);
}
rgb = mix(rgb, gridColor, gridWeight);