Lesson 5 - Grid
In this lesson, you will learn about the following:
- Drawing straight lines using Line Geometry or screen-space techniques.
- Drawing dots grid.
$button = call(() => {
    const $button = document.createElement('button');
    $button.textContent = 'FlyTo origin';
    return $button;
});checkboardStyle = Inputs.radio(['none', 'grid', 'dots'], {
label: 'Checkboard Style',
value: 'grid',
});canvas = call(() => {
const { Canvas } = Lesson5;
return Utils.createCanvas(Canvas, 400, 400);
});call(() => {
const styles = ['none', 'grid', 'dots'];
canvas.setCheckboardStyle(styles.indexOf(checkboardStyle));
});(async () => {
const { Canvas, Circle, Group } = Lesson5;
const solarSystem = new Group();
const earthOrbit = new Group();
const moonOrbit = new Group();
const sun = new Circle({
cx: 0,
cy: 0,
r: 100,
fill: 'red',
});
const earth = new Circle({
cx: 0,
cy: 0,
r: 50,
fill: 'blue',
});
const moon = new Circle({
cx: 0,
cy: 0,
r: 25,
fill: 'yellow',
});
solarSystem.appendChild(sun);
solarSystem.appendChild(earthOrbit);
earthOrbit.appendChild(earth);
earthOrbit.appendChild(moonOrbit);
moonOrbit.appendChild(moon);
solarSystem.position.x = 200;
solarSystem.position.y = 200;
earthOrbit.position.x = 100;
moonOrbit.position.x = 100;
canvas.appendChild(solarSystem);
let id;
const animate = () => {
solarSystem.rotation += 0.01;
earthOrbit.rotation += 0.02;
canvas.render();
id = requestAnimationFrame(animate);
};
animate();
unsubscribe(() => {
cancelAnimationFrame(id);
canvas.destroy();
});
const landmark = canvas.camera.createLandmark({
x: 0,
y: 0,
zoom: 1,
rotation: 0,
});
$button.onclick = () => {
canvas.camera.gotoLandmark(landmark, {
duration: 1000,
easing: 'ease',
});
};
return canvas.getDOM();
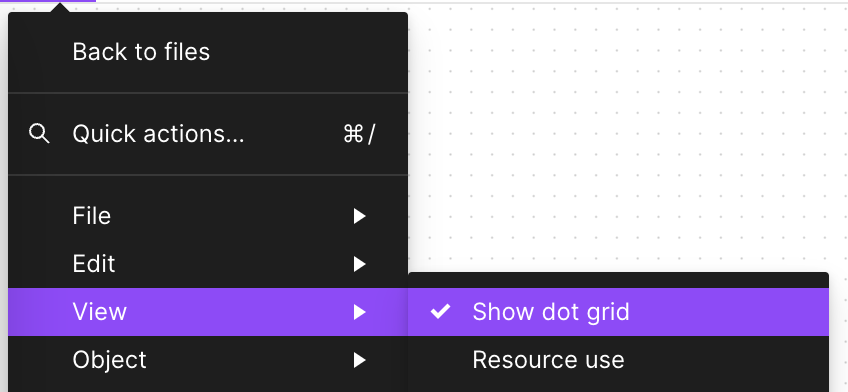
})();In Figma and FigJam, grids appear when zooming in to a certain level, with the former displaying as lines and the latter as dots.
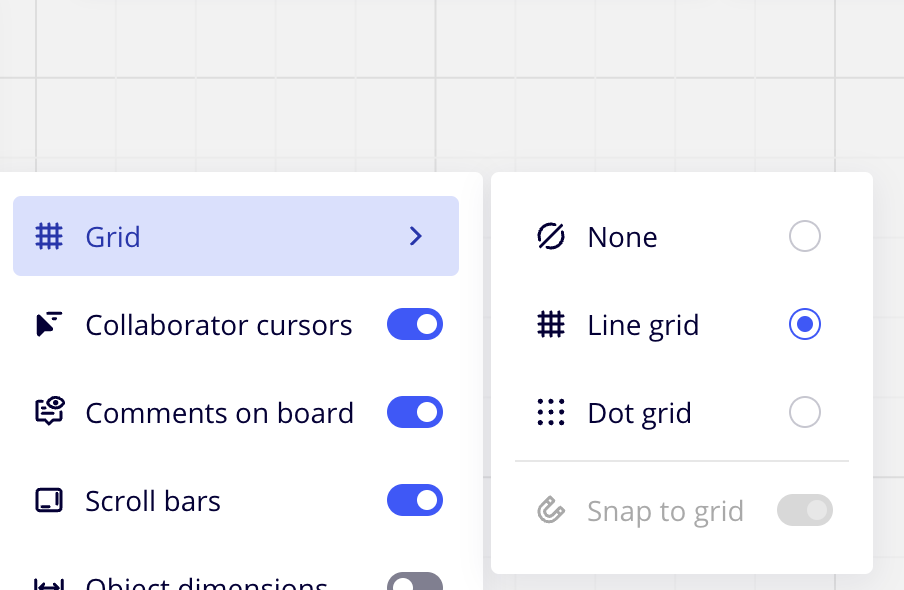
Miro supports switching between lines and dots:
Let's start with lines grid.
Lines grid
Firstly, the grid should not be part of the scene graph. We do not want the grid to scale up and down as the canvas is zoomed. However, we do want it to have a fade-in and fade-out effect as zooming occurs. Therefore, we first render the grid in the beginFrame hook, passing in necessary information from the scene, such as the camera:
hooks.initAsync.tapPromise(async () => {
    this.#grid = new Grid();
});
hooks.beginFrame.tap(() => {
    this.#grid.render(
        this.#device,
        this.#renderPass,
        this.#uniformBuffer,
        camera,
    );
});
Line Geometry
The most straightforward approach is similar to GridHelper - Three.js, where a set of lines is created based on the grid size:
// https://github.com/mrdoob/three.js/blob/master/src/helpers/GridHelper.js#L25-L37
for (var i = 0, j = 0, k = -halfSize; i <= divisions; i++, k += step) {
    vertices.push(-halfSize, 0, k, halfSize, 0, k);
    vertices.push(k, 0, -halfSize, k, 0, halfSize);
}

var geometry = new BufferGeometry();
geometry.addAttribute('position', new Float32BufferAttribute(vertices, 3));
geometry.addAttribute('color', new Float32BufferAttribute(colors, 3));

var material = new LineBasicMaterial({ vertexColors: VertexColors });
LineSegments.call(this, geometry, material);
In the thetamath project by Figma CTO Evan, the grid is also implemented in this manner, constructing the necessary lines for the grid from both horizontal and vertical directions:
for (let x = left; x < right; x++) {
    const tx = ox + (x * zoom) / step;
    this.strokeLine();
}
for (let y = top; y < bottom; y++) {
    const ty = oy - (y * zoom) / step;
    this.strokeLine();
}
How do we draw straight lines in WebGL? I have previously written a piece on 在 WebGL 中绘制直线. In a nutshell, if we don't consider the joints, we only need to stretch outwards on both sides along the normal direction, using two triangles to draw:
thetamath also employs two small tricks. The first one is the use of Triangle strip which, compared to regular Triangles, can save on the number of vertices, reducing from 3N to N + 2, where N is the number of triangles:
this.#pipeline = device.createRenderPipeline({
    inputLayout: this.#inputLayout,
    program: this.#program,
    colorAttachmentFormats: [Format.U8_RGBA_RT],
    topology: PrimitiveTopology.TRIANGLE_STRIP,
});
Secondly, it stores the color in four Bytes:
255 | (255 << 8) | (255 << 16) | (127 << 24);Along with vertexAttribPointer, it declares that each component is gl.UNSIGNED_BYTE and needs to be normalized:
this.#inputLayout = device.createInputLayout({
  vertexBufferDescriptors: [
    {
      arrayStride: 4 * 5,
      stepMode: VertexStepMode.VERTEX,
      attributes: [
        {
          format: Format.F32_RGBA,
          offset: 0,
          shaderLocation: 0,
        },
        {
          format: Format.U8_RGBA_NORM,
          offset: 4 * 4,
          shaderLocation: 1,
        },
      ],
    },
  ],
  indexBufferFormat: null,
  program: this.#program,
});
Let's try it out:
(async () => {
    const { Canvas, Circle, Group } = Lesson5;
    const canvas = await Utils.createCanvas(Canvas, 400, 400);

    canvas.setGridImplementation(0);

    const solarSystem = new Group();
    const earthOrbit = new Group();
    const moonOrbit = new Group();

    const sun = new Circle({
        cx: 0,
        cy: 0,
        r: 100,
        fill: 'red',
    });
    const earth = new Circle({
        cx: 0,
        cy: 0,
        r: 50,
        fill: 'blue',
    });
    const moon = new Circle({
        cx: 0,
        cy: 0,
        r: 25,
        fill: 'yellow',
    });
    solarSystem.appendChild(sun);
    solarSystem.appendChild(earthOrbit);
    earthOrbit.appendChild(earth);
    earthOrbit.appendChild(moonOrbit);
    moonOrbit.appendChild(moon);

    solarSystem.position.x = 200;
    solarSystem.position.y = 200;
    earthOrbit.position.x = 100;
    moonOrbit.position.x = 100;

    canvas.appendChild(solarSystem);

    let id;
    const animate = () => {
        solarSystem.rotation += 0.01;
        earthOrbit.rotation += 0.02;
        canvas.render();
        id = requestAnimationFrame(animate);
    };
    animate();

    unsubscribe(() => {
        cancelAnimationFrame(id);
        canvas.destroy();
    });

    return canvas.getDOM();
})();
In this method, the larger the canvas size and the higher the grid density, the more vertices are needed. Is there a way to achieve this with fewer vertices? Since the grid always fills the entire screen, can it be accomplished in screen space?
Fragment Shader
Just as Building Flexible and Powerful Cross-Sections with GridPaper and WebGL says:
Instead of rendering all these lines as geometry, we can use a WebGL fragment shader to generate the lines on a per-pixel basis.
The advantage of implementing it in screen space is that only a single Quad that fills the screen is needed, requiring only four vertices, into which coordinates under the clip coordinate system are passed. Of course, it's also possible to use a fullscreen triangle, which only requires three vertices. This approach is quite common in post-processing:
this.appendVertex(-1, -1);
this.appendVertex(-1, 1);
this.appendVertex(1, -1);
this.appendVertex(1, 1);
This way, in the Vertex Shader, you can use them directly without any transformations:
layout(location = 0) in vec4 a_Position;
void main() {
  gl_Position = vec4(a_Position.xy, 0, 1);
}
To draw the grid in the Fragment Shader, you will need the coordinates of the pixel points in the world coordinate system. Therefore, by using the inverse of the camera's projection transformation matrix, you can convert the coordinates from the clip coordinate system to the world coordinate system:
layout(std140) uniform SceneUniforms {
mat3 u_ProjectionMatrix;
mat3 u_ViewMatrix;
mat3 u_ViewProjectionInvMatrix;
};
out vec2 v_Position;
vec2 project_clipspace_to_world(vec2 p) {
return (u_ViewProjectionInvMatrix * vec3(p, 1.0)).xy;
}
void main() {
v_Position = project_clipspace_to_world(a_Position.xy);
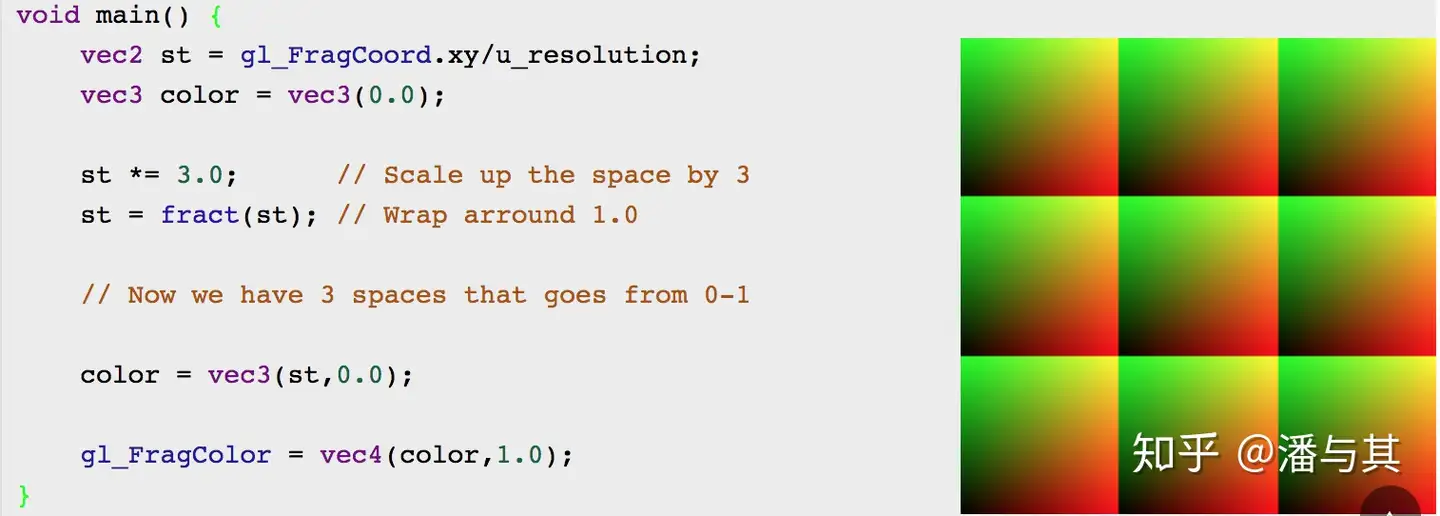
}In Canvas2D and SVG, grids are commonly implemented using Patterns. The basic idea in implementing this with a Fragment Shader is also similar, which involves using the built-in function fract to draw a Pattern. By scaling the initial coordinate space by a factor of n, and then using fract to obtain the fractional part, you only need to consider a small block with coordinate range 0-1. For more information, you can refer to the book of shaders - Patterns.
The following code is from Evan's Anti-Aliased Grid Shader:
vec4 render_grid_checkerboard(vec2 coord) {
  // Compute anti-aliased world-space grid lines
  vec2 grid = abs(fract(coord / gridSize - 0.5) - 0.5) / fwidth(coord) * gridSize;
  float line = min(grid.x, grid.y);
  float alpha = 1.0 - min(line, 1.0);
}
We want to draw two sets of grids with different thicknesses, where the spacing of the fine grid is 1/5 of the coarse grid. At the same time, we check if the current pixel point is closer to the coarse grid:
vec2 size = scale_grid_size(u_ZoomScale);
float gridSize1 = size.x;
float gridSize2 = gridSize1 / 5.0;
Dots grid
For a dot grid, we still opt to handle it within the Fragment Shader in screen space. While it's possible to draw circles using the Signed Distance Field (SDF) method we discussed before, doing so would require a large number of vertices. Therefore, we continue to reuse the Pattern for straight line grids, only here we employ SDF to determine whether a pixel point is within a circle, a method we've already covered in the second lesson:
vec2 grid2 = abs(fract(coord / gridSize2 - 0.5) - 0.5) / fwidth(coord) * gridSize2;
alpha = smoothstep(1.0, 0.0, length(grid2) - BASE_DOT_SIZE * u_ZoomScale / zoomStep);
To support switching between straight line grids and dot grids, we can introduce a new uniform variable to differentiate the grid styles.
layout(std140) uniform SceneUniforms {
  mat3 u_ProjectionMatrix;
  mat3 u_ViewMatrix;
  mat3 u_ViewProjectionInvMatrix;
  float u_ZoomScale;
  float u_CheckboardStyle;
};
Now we can draw different grids in Fragment Shader like this:
const int CHECKERBOARD_STYLE_NONE = 0;
const int CHECKERBOARD_STYLE_GRID = 1;
const int CHECKERBOARD_STYLE_DOTS = 2;

vec4 render_grid_checkerboard(vec2 coord) {
  int checkboardStyle = int(floor(u_CheckboardStyle + 0.5));
  if (checkboardStyle == CHECKERBOARD_STYLE_GRID) {
    // lines grid
  } else if (checkboardStyle == CHECKERBOARD_STYLE_DOTS) {
    // dots grid
  }
}
You can go back to the example at the beginning of the page and switch between different grid styles.
Adjusting Brightness
In the shaders used in Figma / FigJam, the brightness of colors is also calculated, and based on the brightness values, the colors are adjusted. Specifically, it employs a brightness-based color adjustment algorithm designed to improve the visual appeal of colors, making text or graphics more clearly visible against brighter backgrounds.
A weight vector weights has been defined, with weights set according to the non-linear characteristics of the human eye's perception of brightness for different colors. This is commonly used to calculate brightness values in the RGB color space.
vec3 gridColor; // 存储最终调整后的颜色值
vec3 weights = vec3(0.299, 0.587, 0.114);
float c2 = dot(rgb * rgb, weights); // 计算了RGB颜色值的加权平方和,这个值c2是颜色亮度的一个估计值
float luminance = sqrt(c2);
If the brightness value is greater than 0.5, this indicates that the color itself is already quite bright. The code will calculate an adjustment factor target, and use it to modify the color value rgb, making the color slightly darker. This change ensures that the color is easier to observe against a bright background. If the brightness value is not greater than 0.5, the color itself is comparatively dark, and the code will take an alternative strategy to adjust the color.
First, it calculates a new brightness target value target, and then uses the mix function to blend the rgb color with pure white vec3(1), based on the calculation results of b and a. The final color mix ratio is determined by the relation of b to a. Here, a and b are calculated based on the original color's brightness value, and are used to control the color adjustment process.
if (luminance > 0.5) {
    float target = (luminance - 0.05) / luminance;
    gridColor = rgb * target;
}
else {
    float target = luminance * 0.8 + 0.15;
    float c1 = dot(rgb, weights);
    float a = 1.0 - 2.0 * c1 + c2;
    float b = c2 - c1;
    gridColor = mix(rgb, vec3(1), (b + sqrt(b * b - a * (c2 - target * target))) / a);
}
rgb = mix(rgb, gridColor, gridWeight);