G2
图表示例
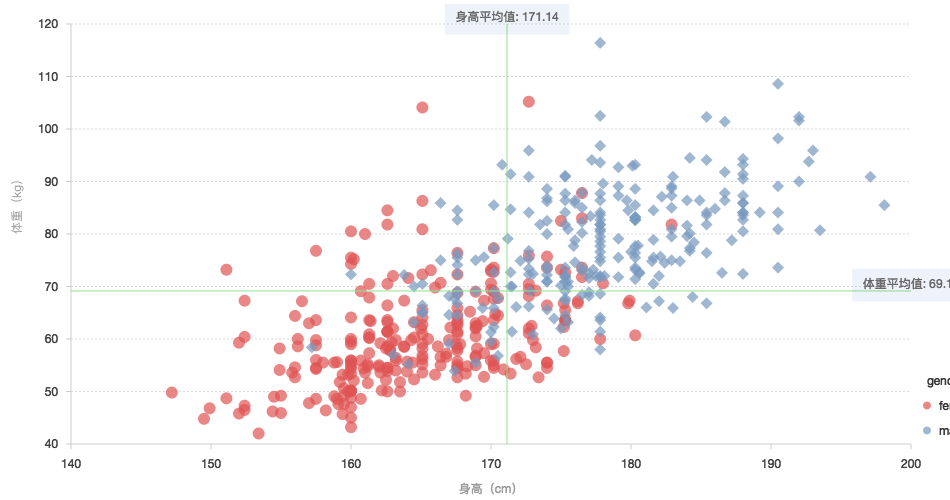
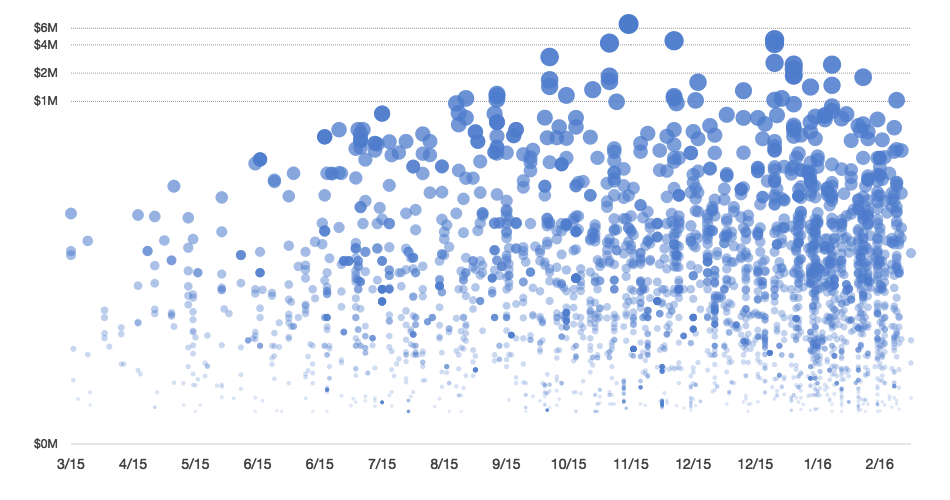
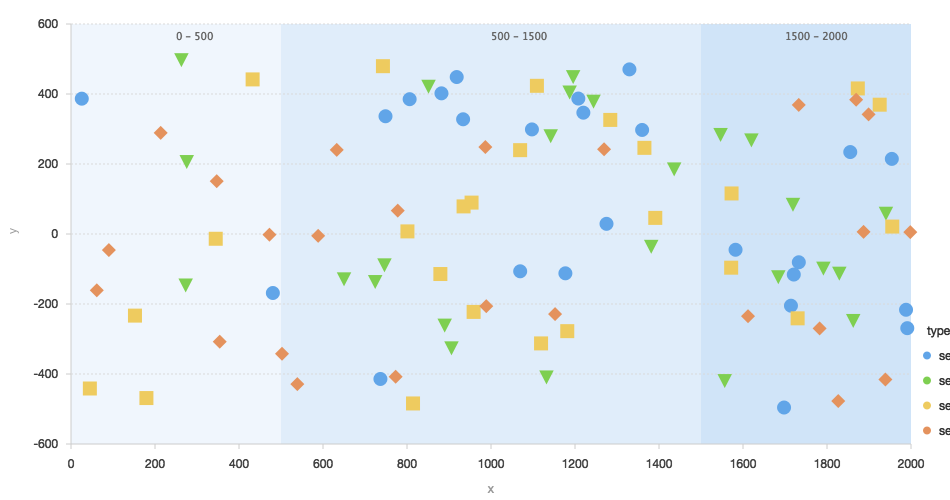
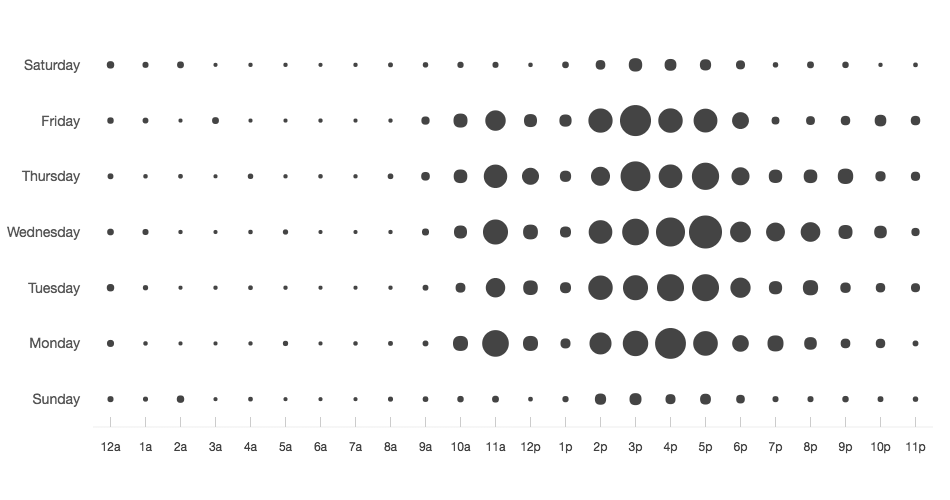
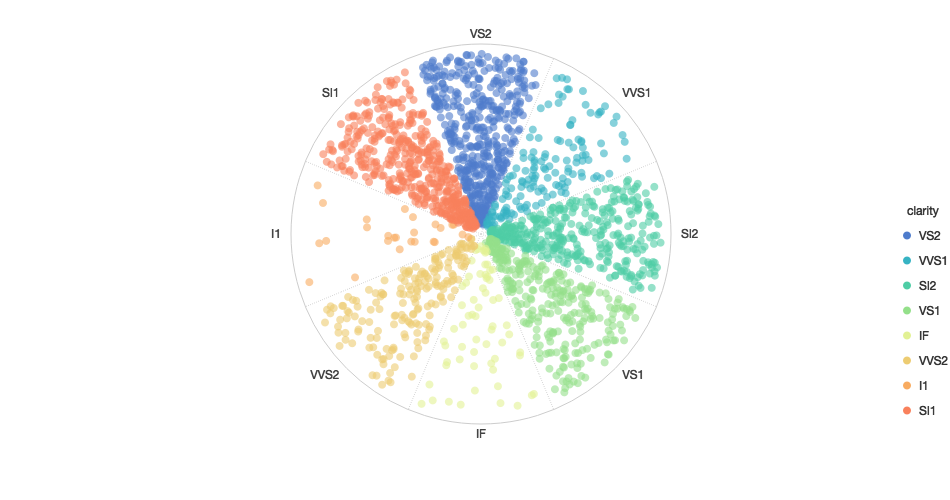
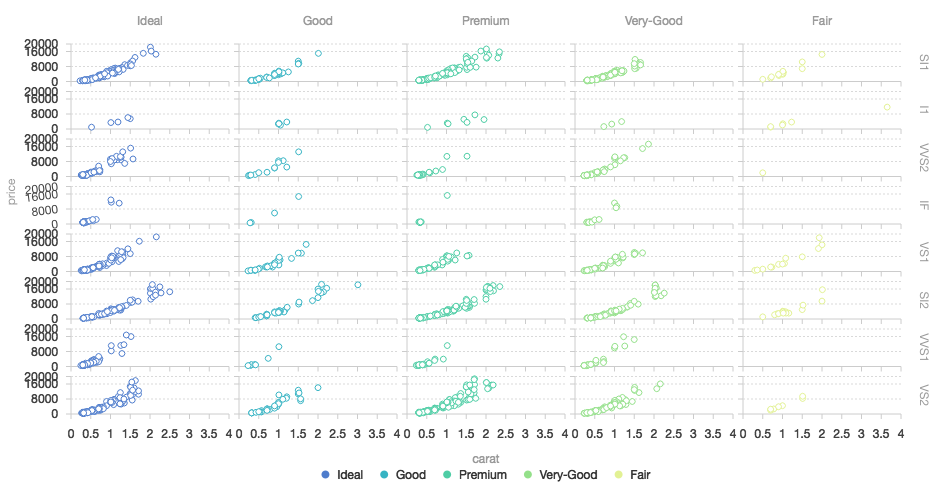
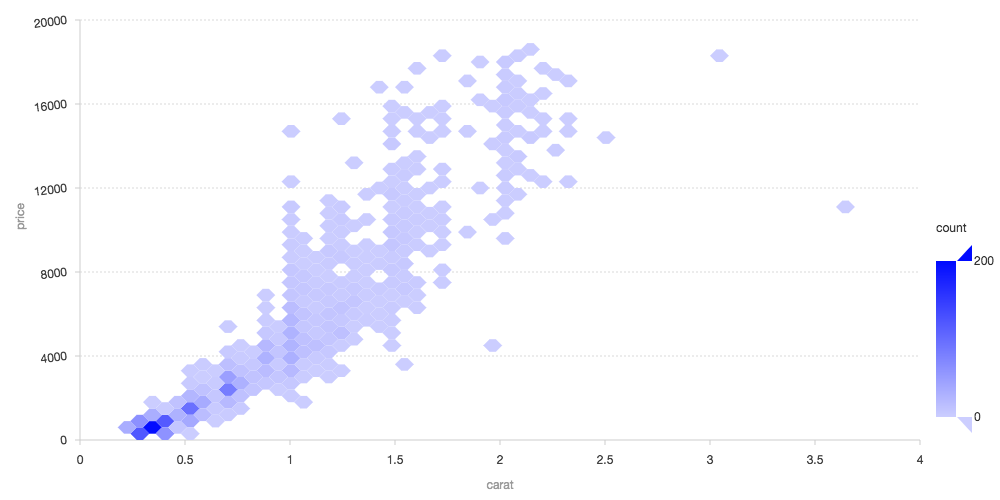
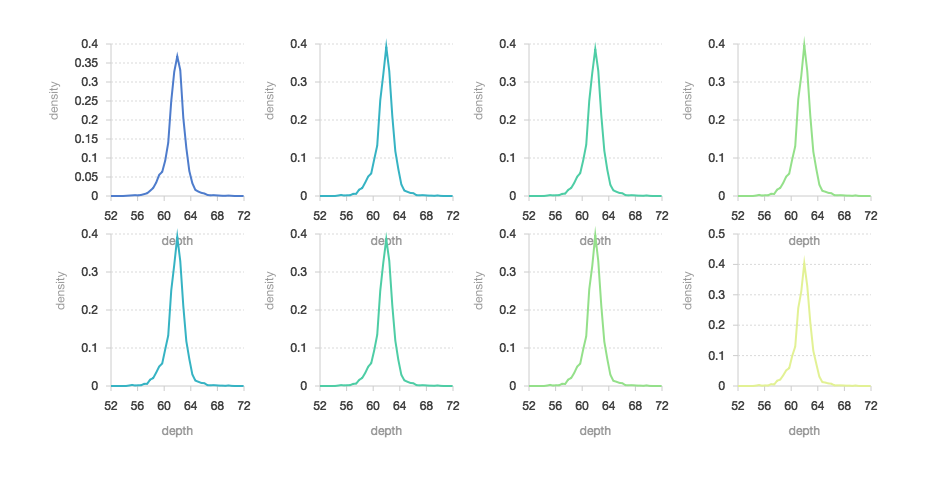
点图
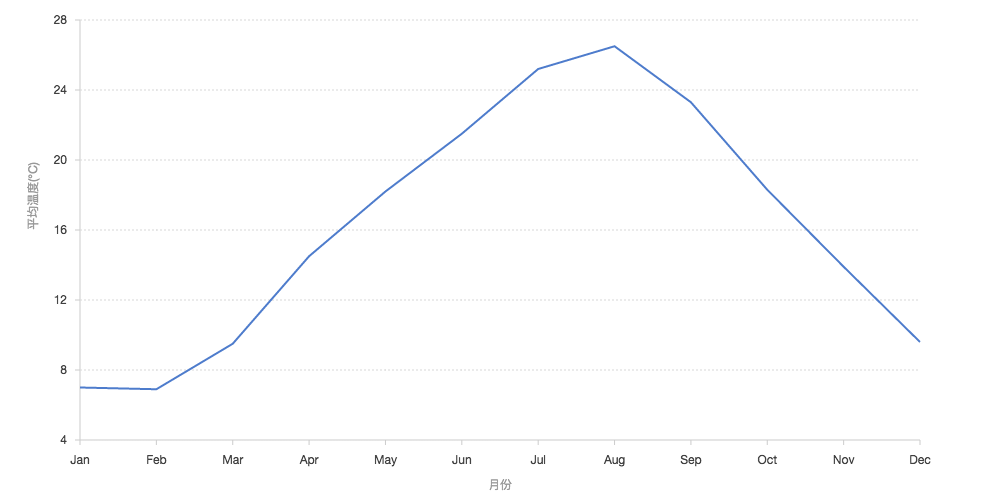
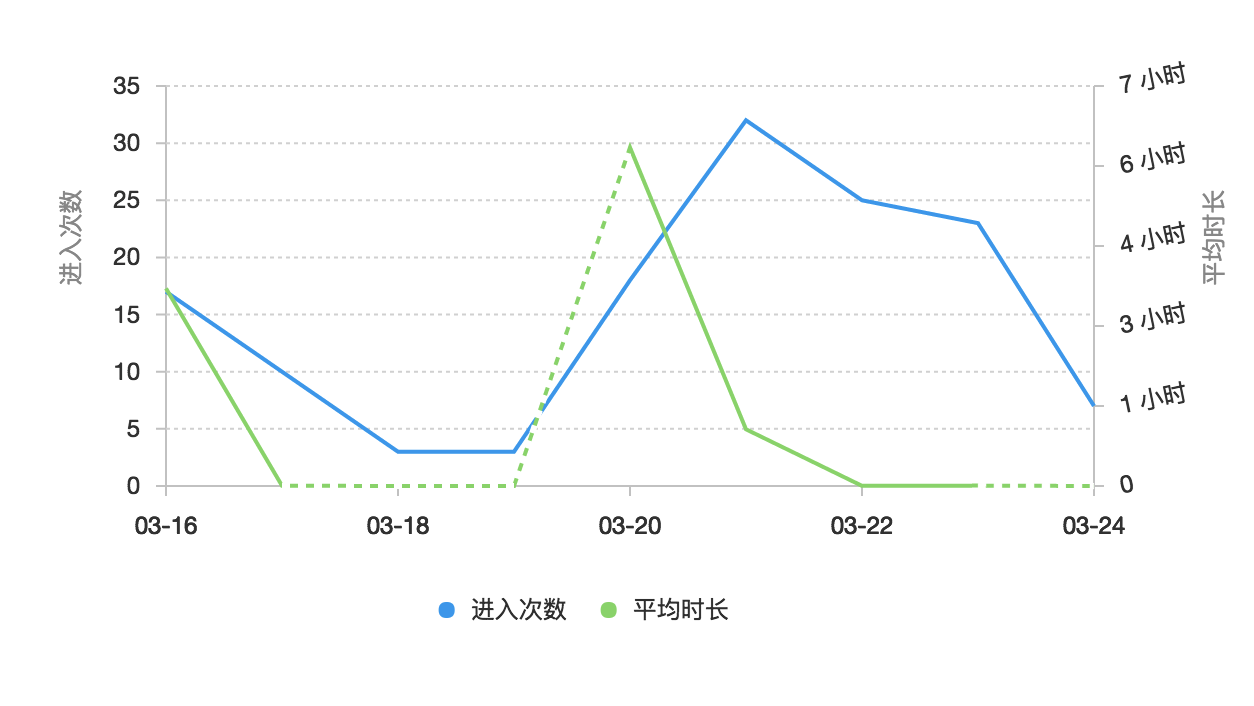
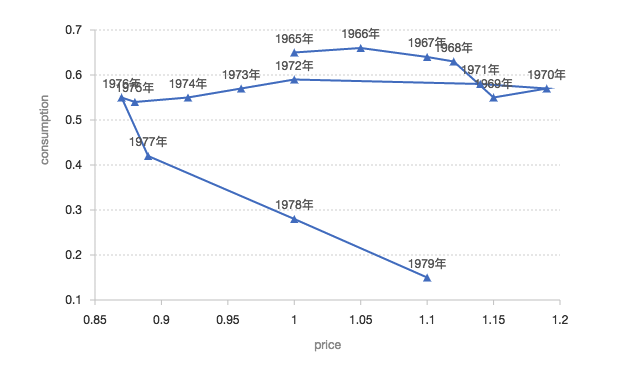
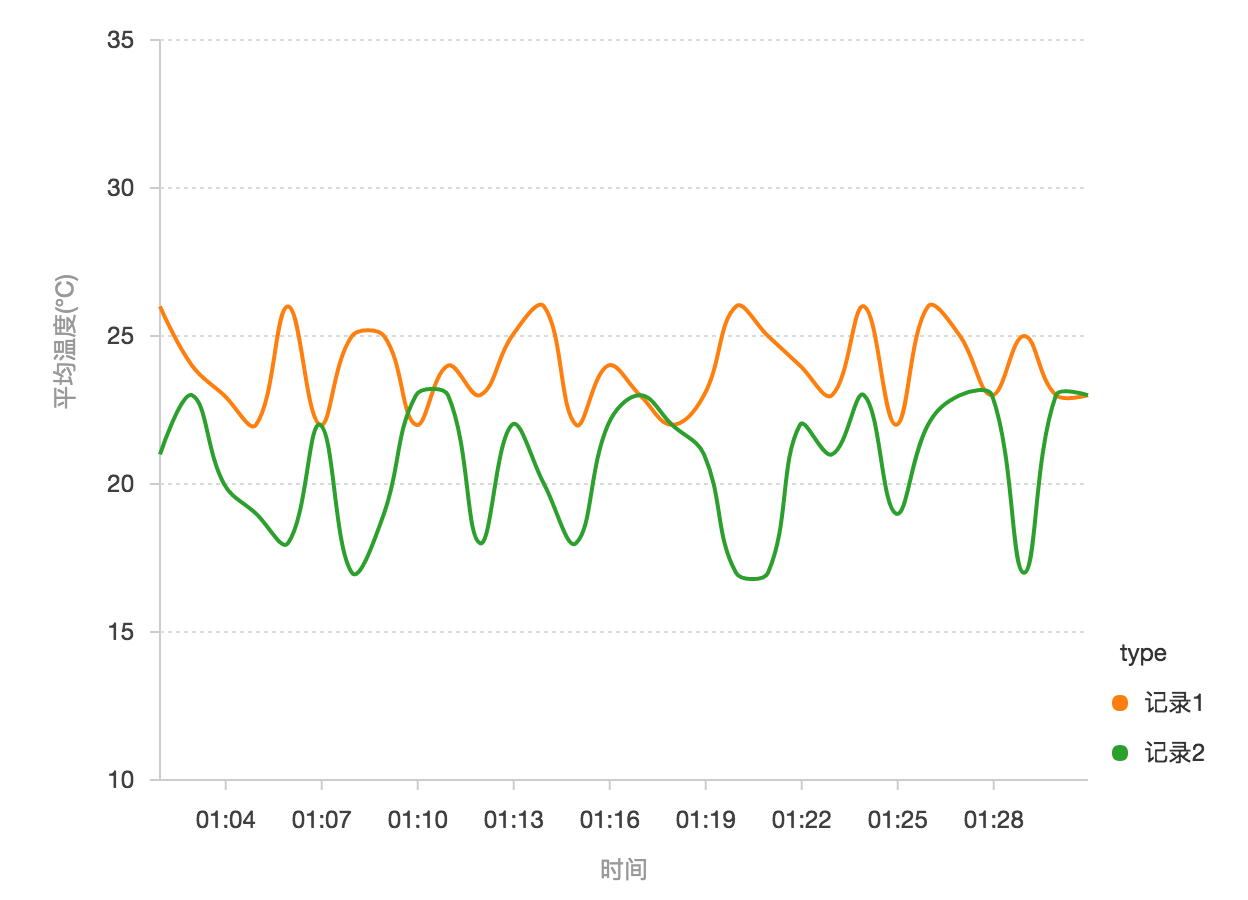
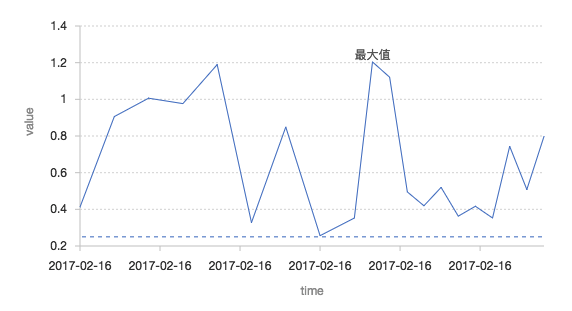
线图
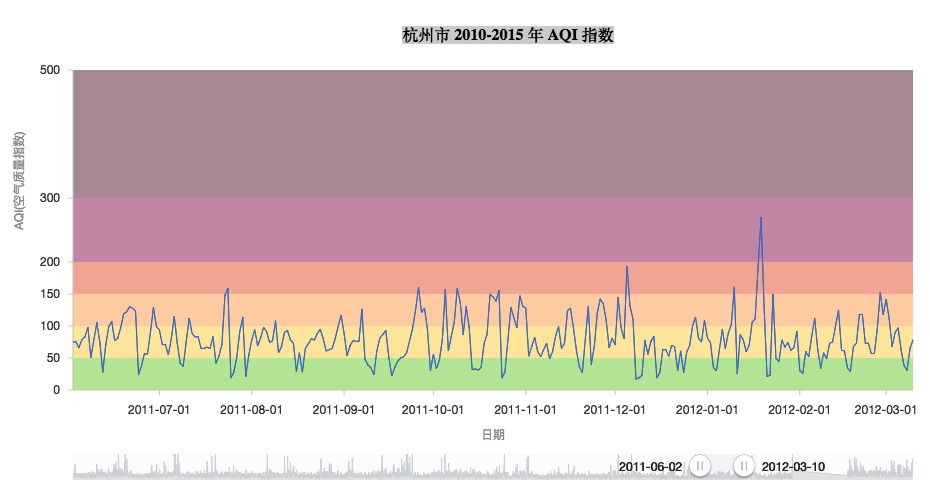
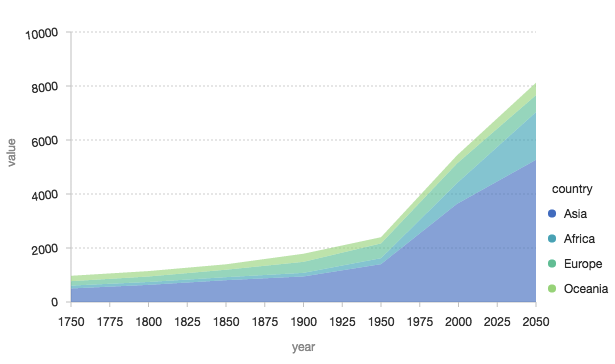
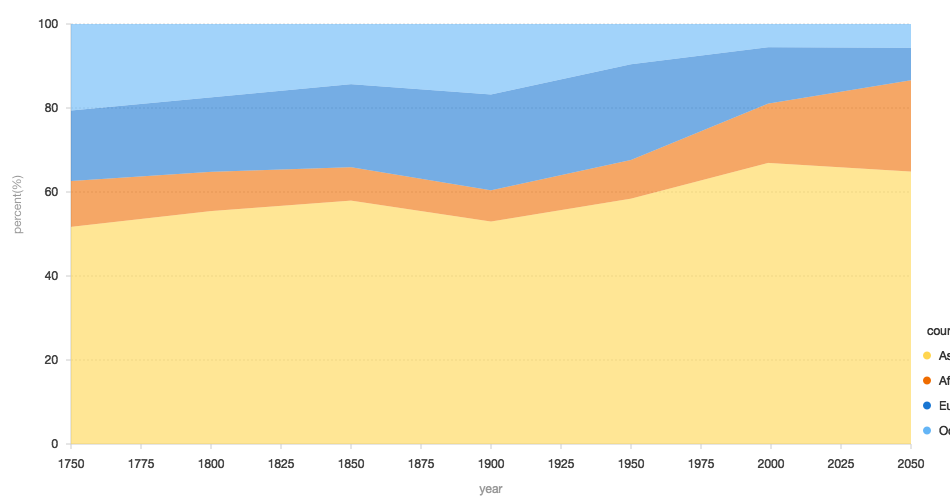
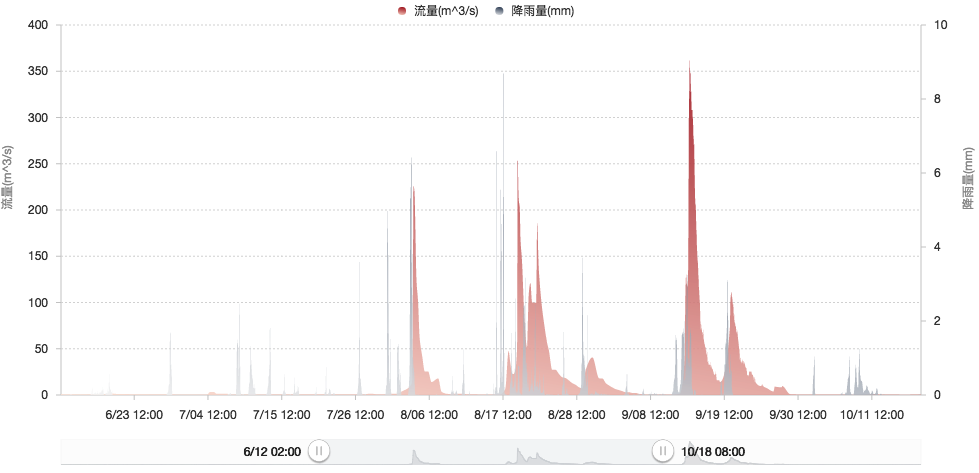
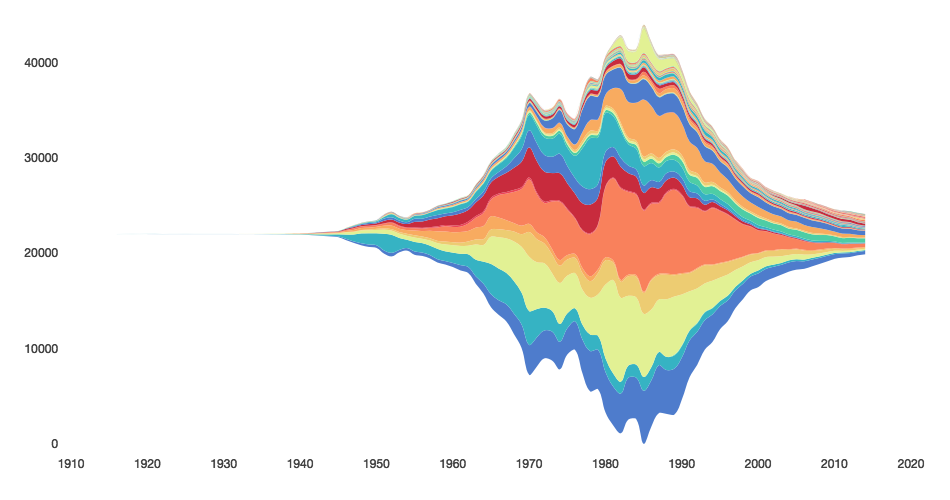
区域图
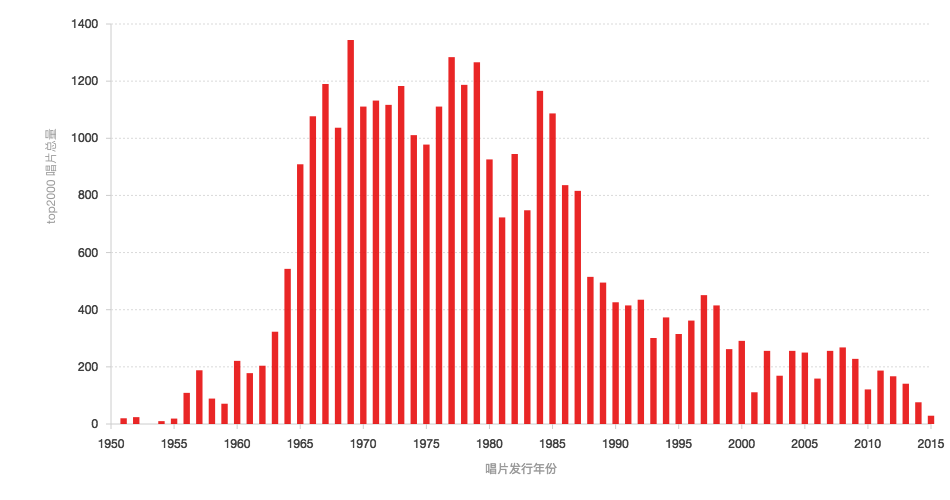
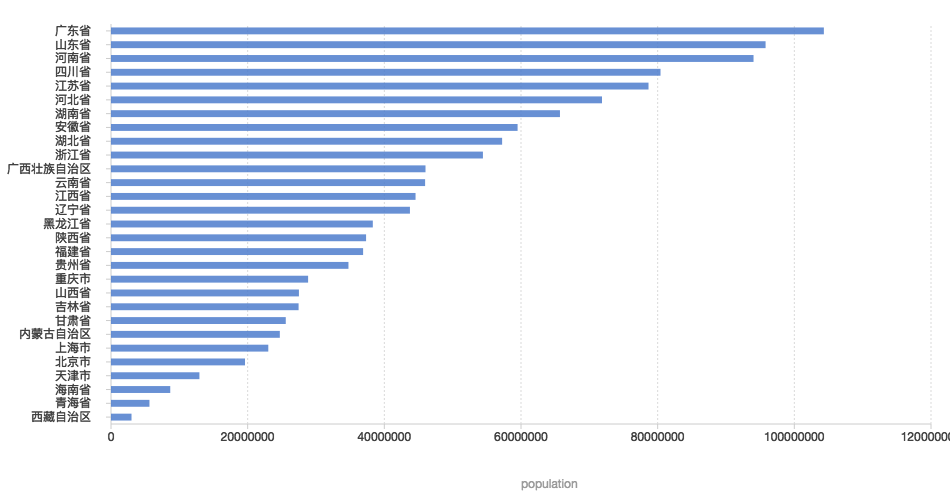
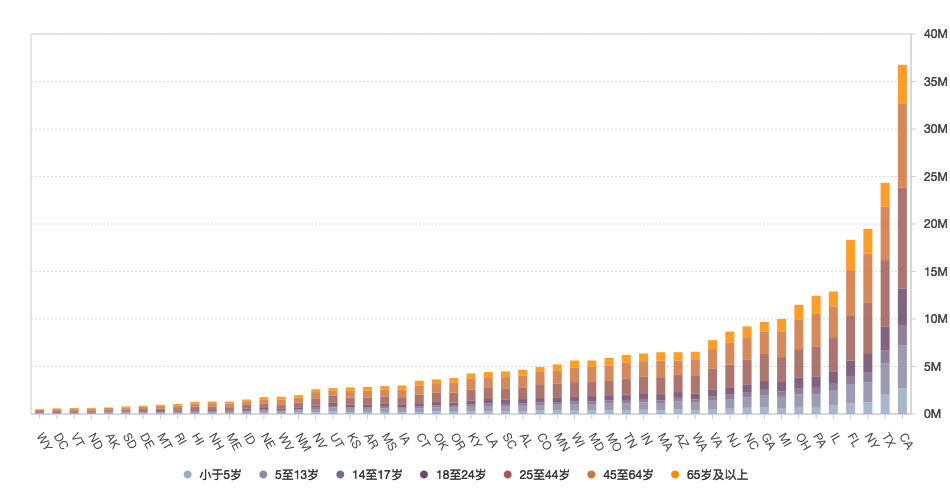
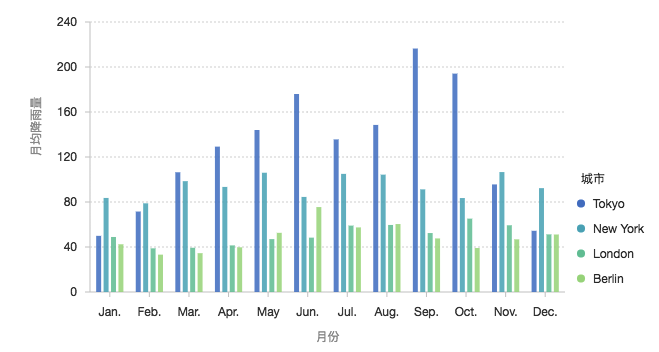
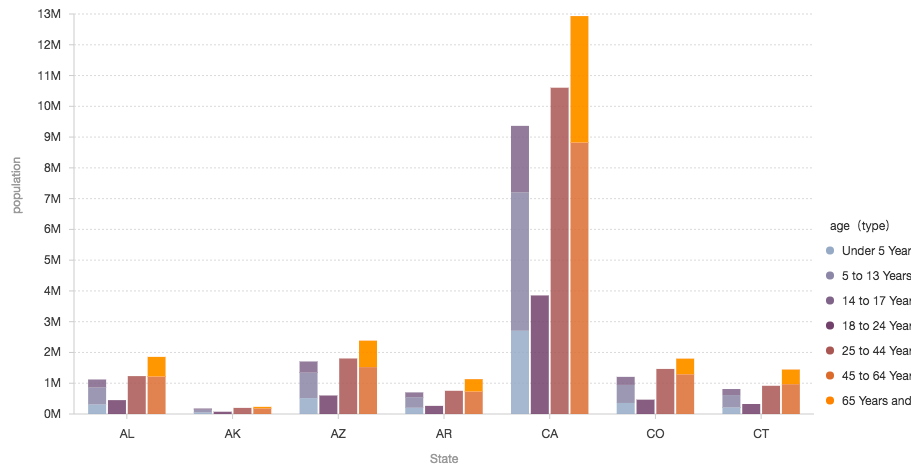
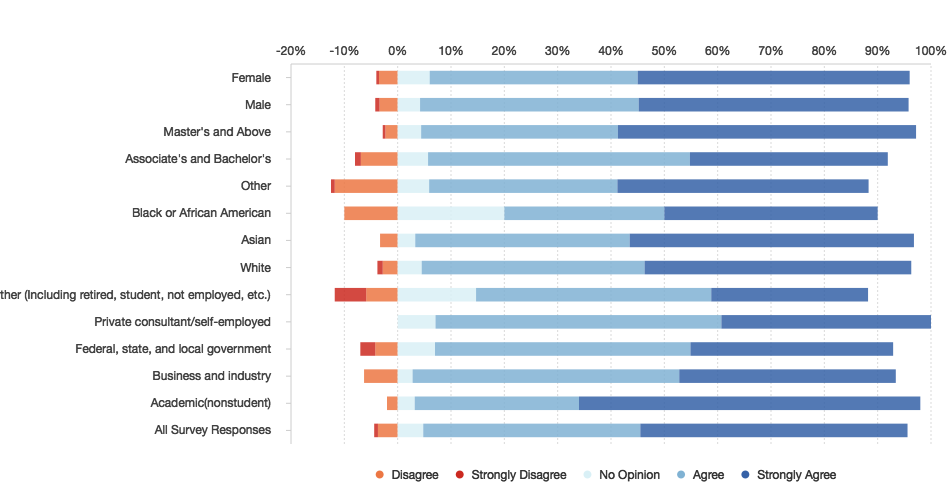
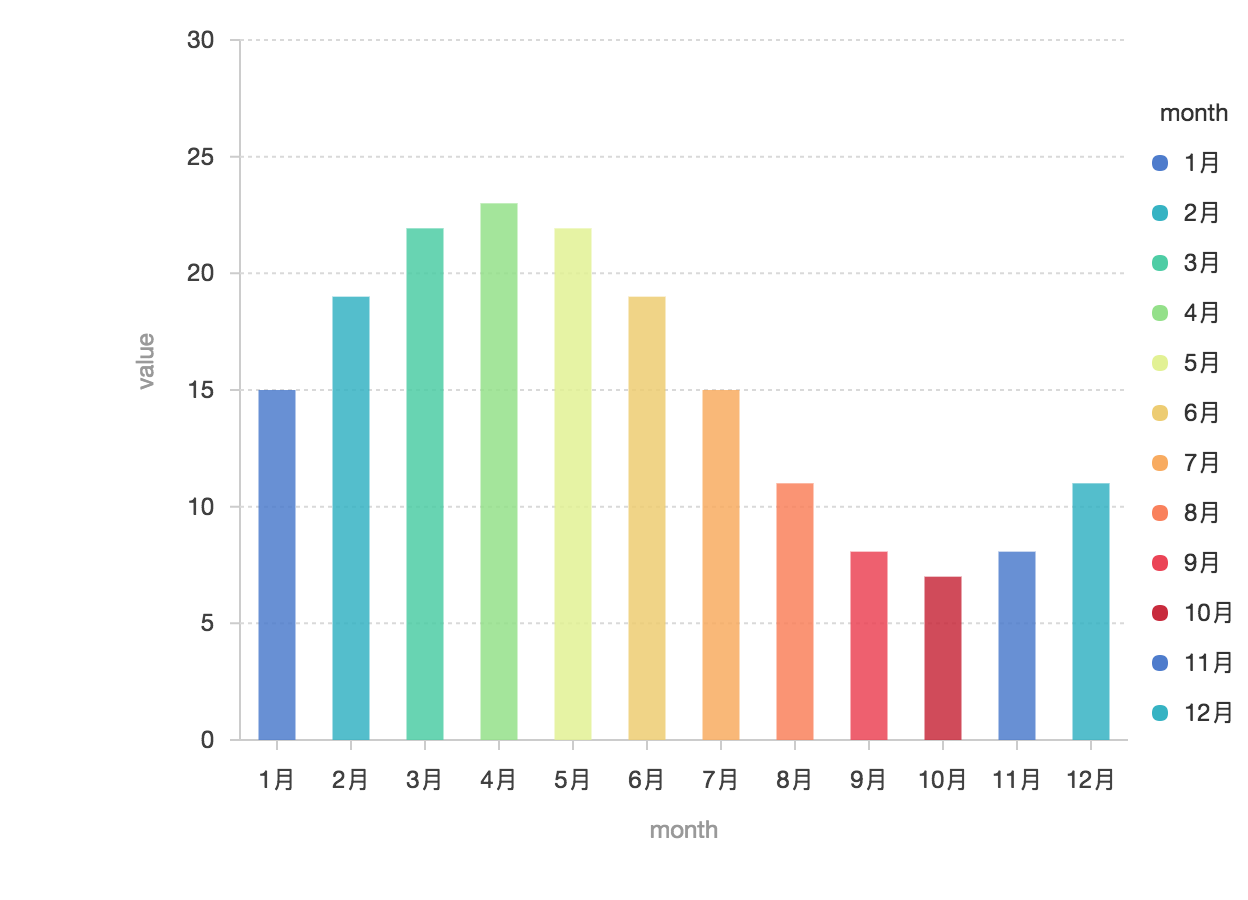
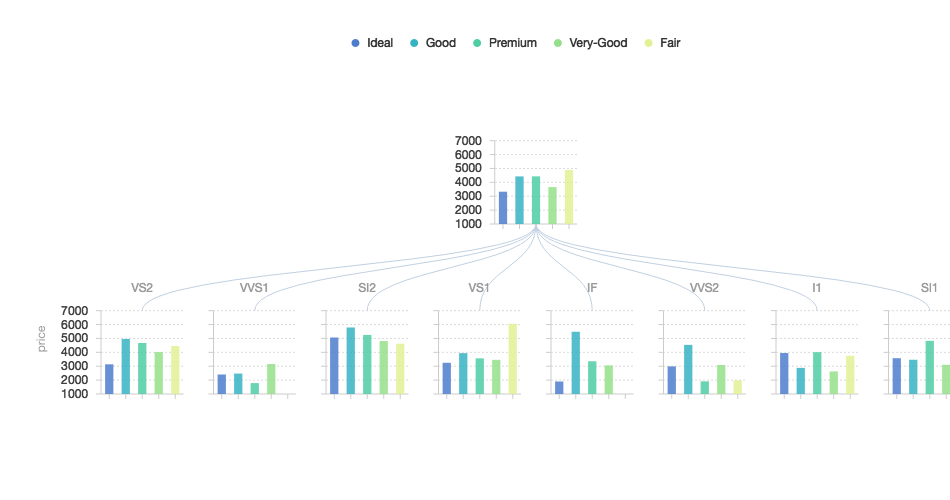
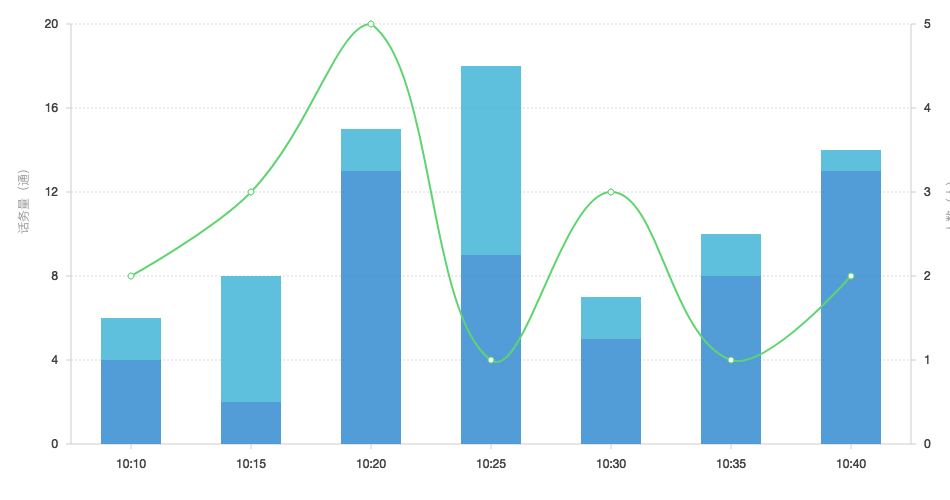
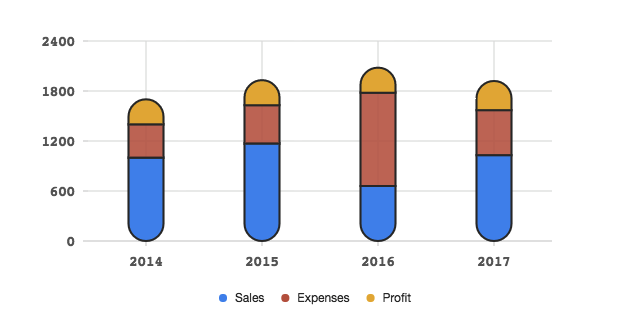
柱状图
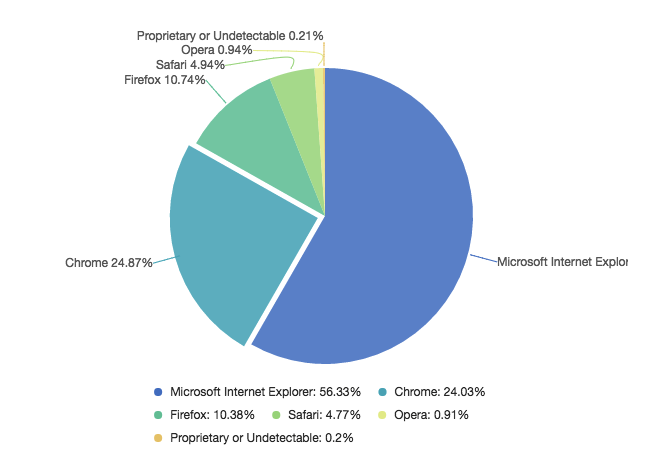
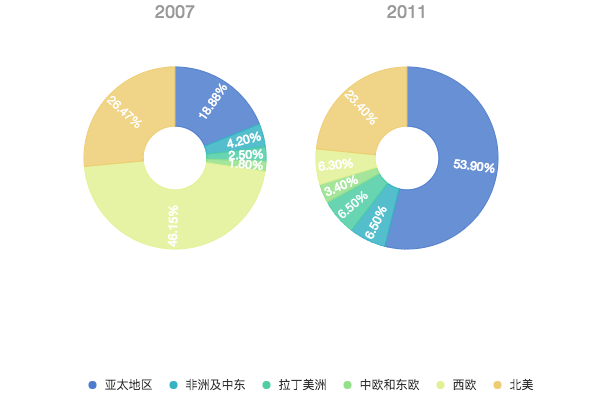
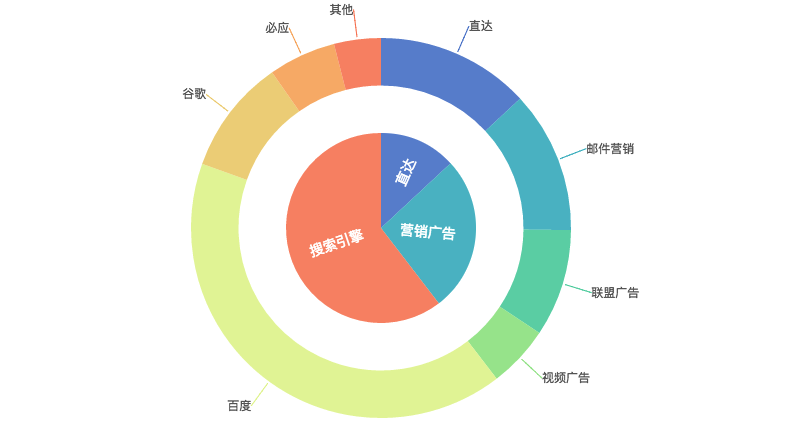
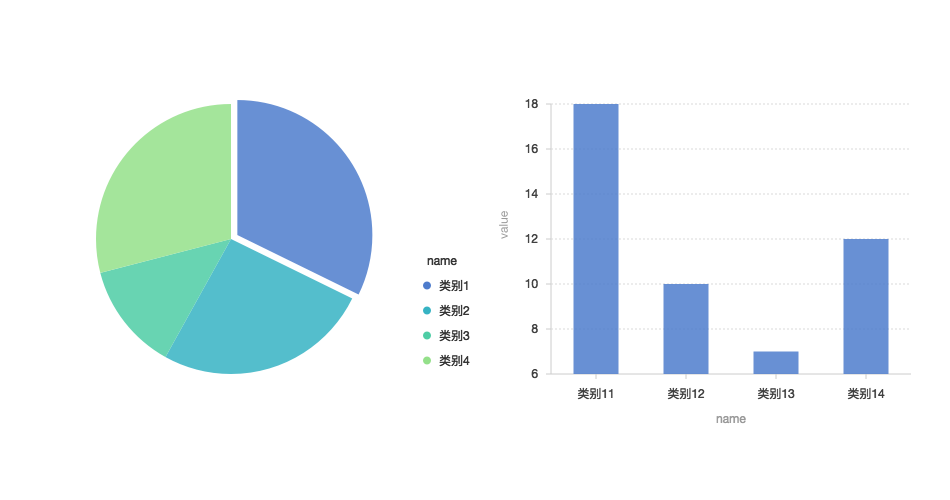
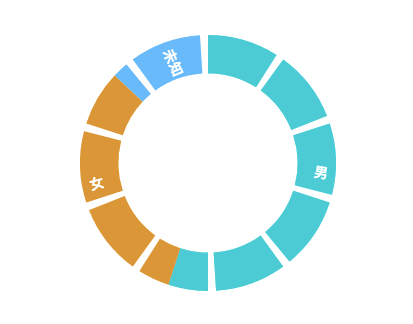
饼图
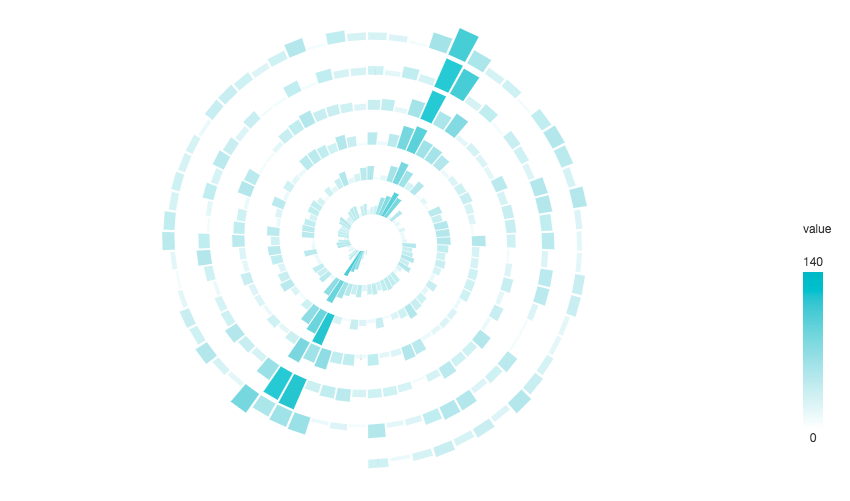
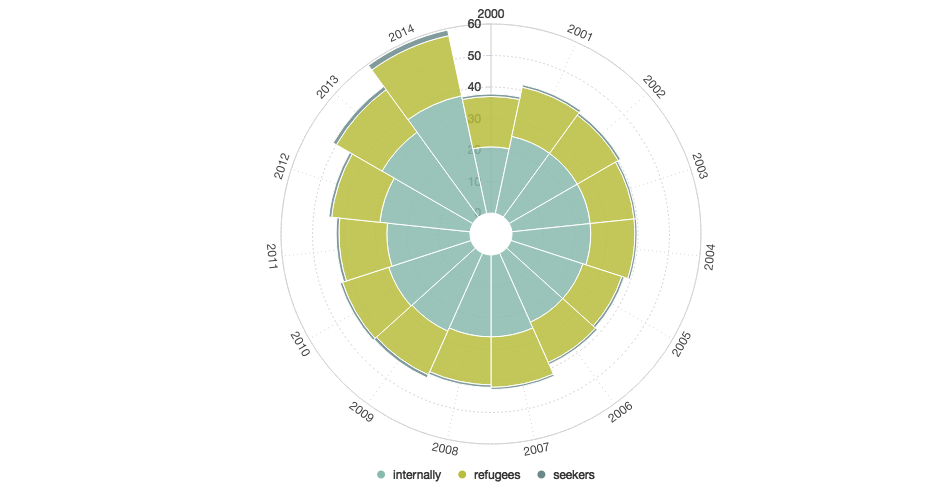
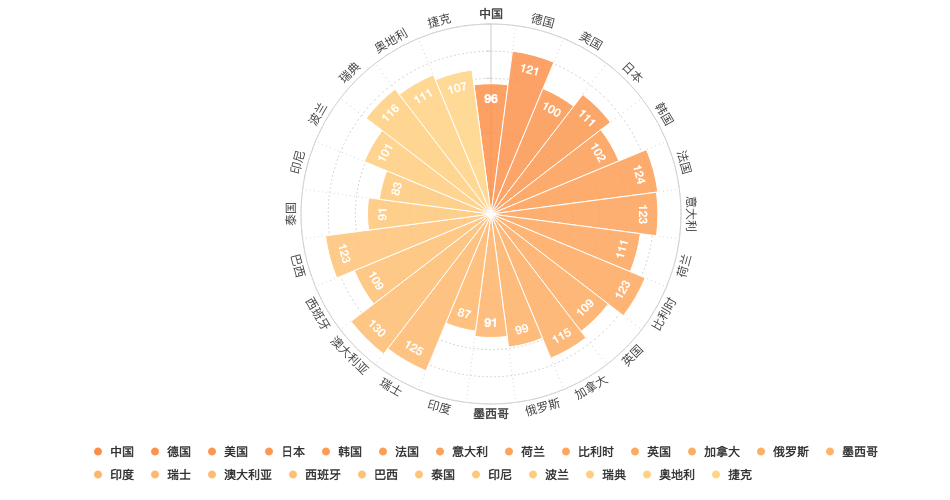
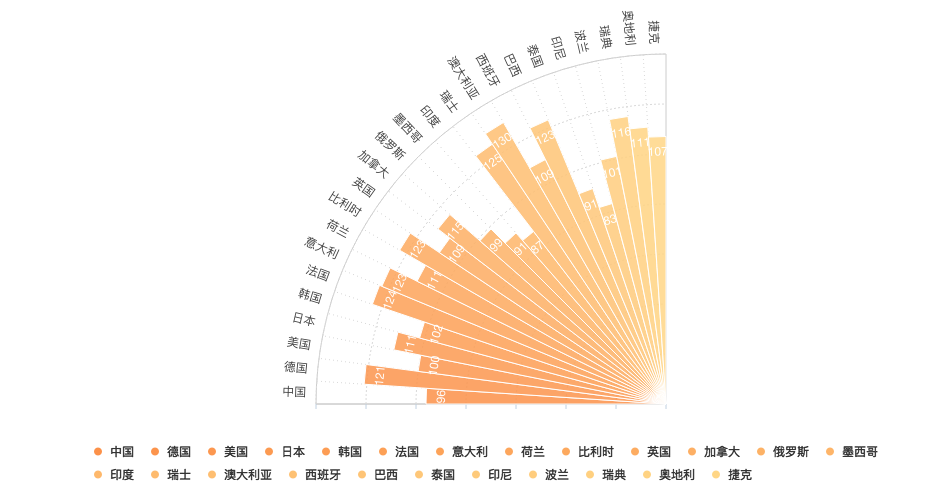
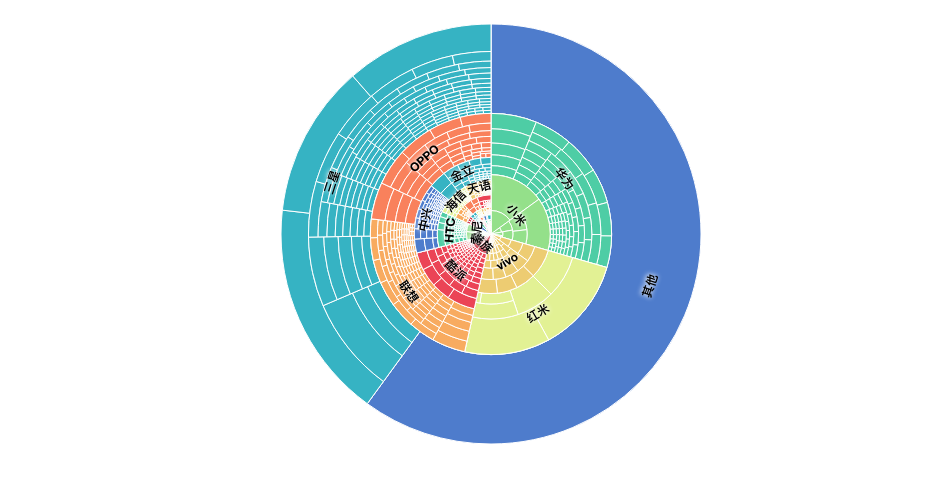
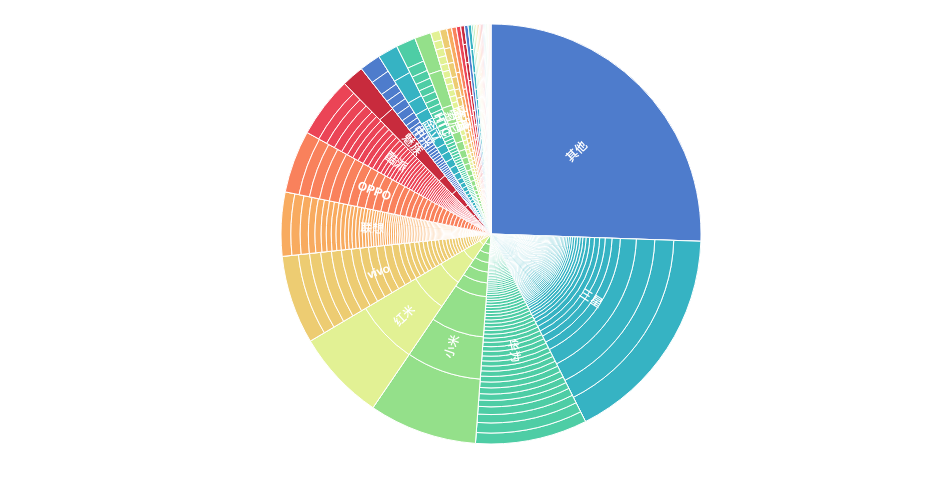
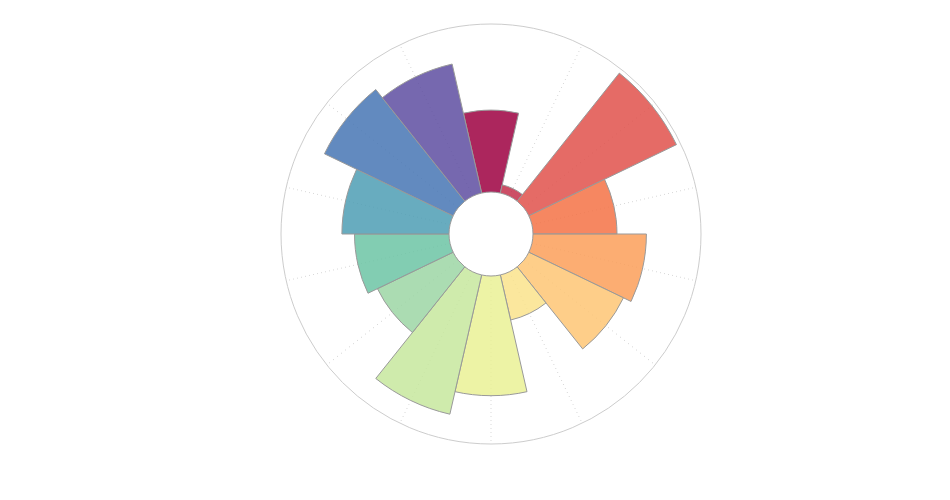
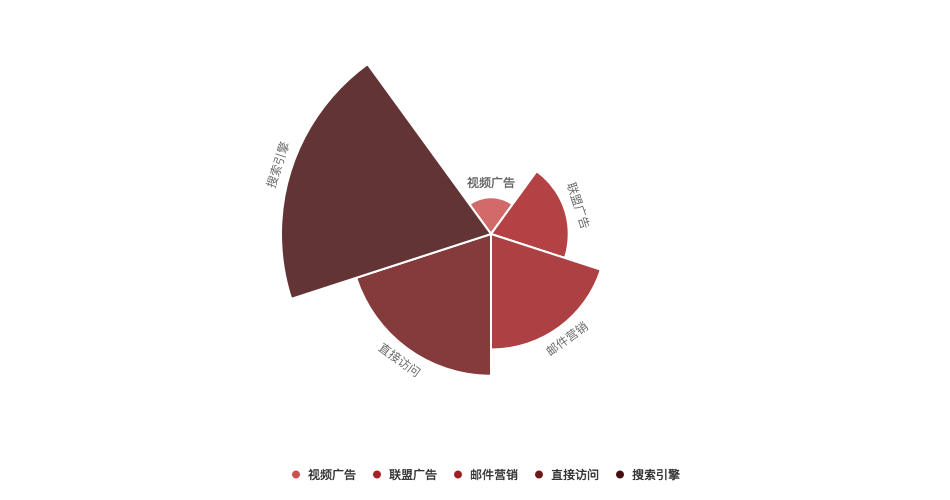
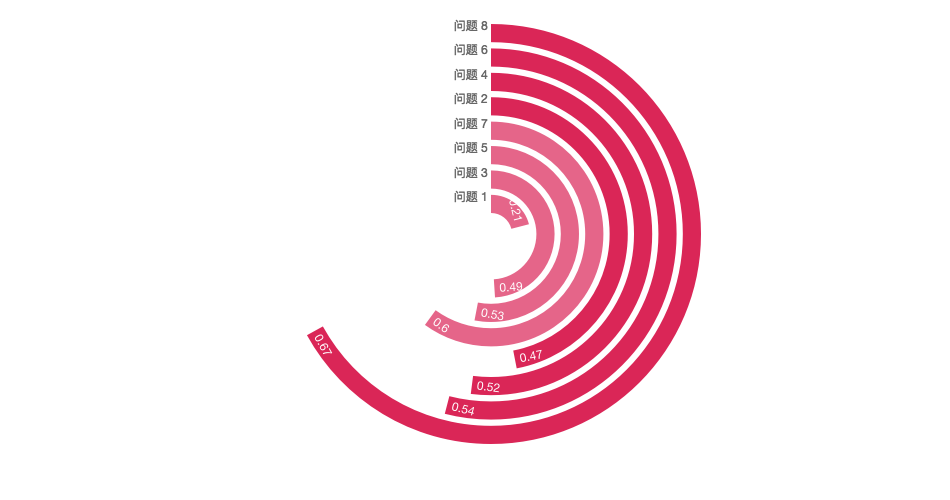
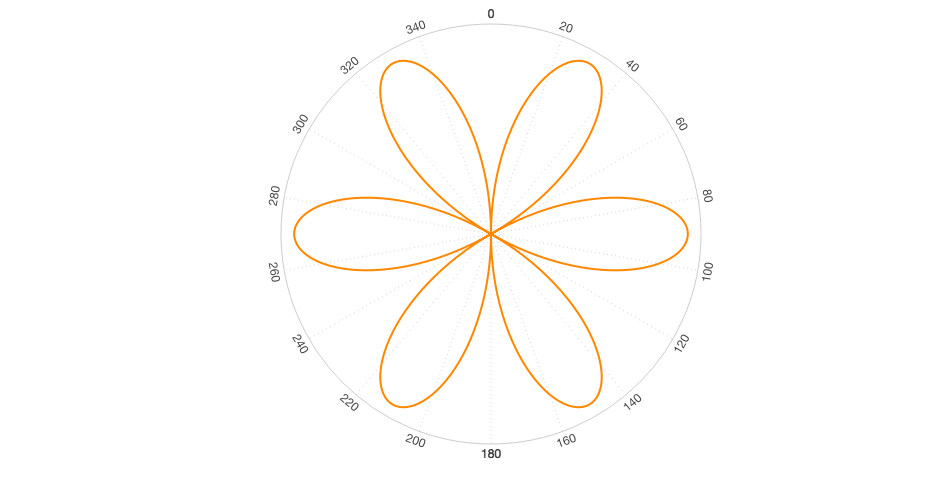
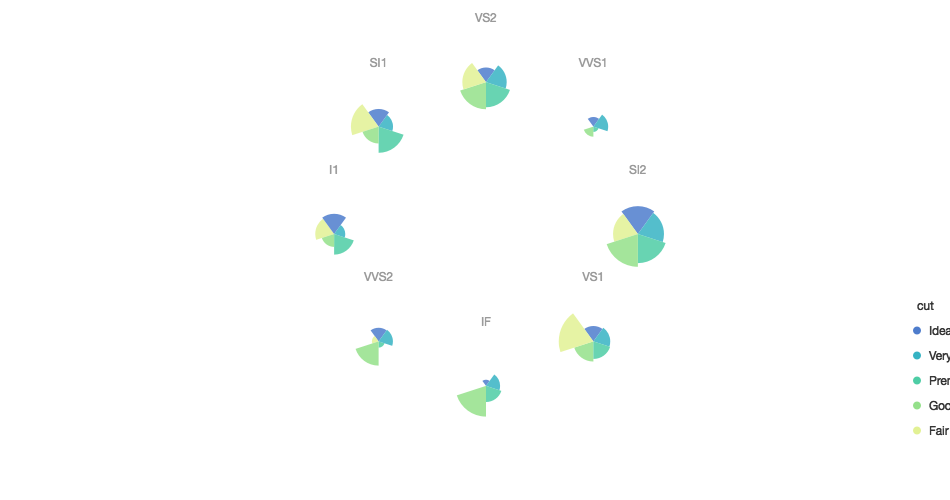
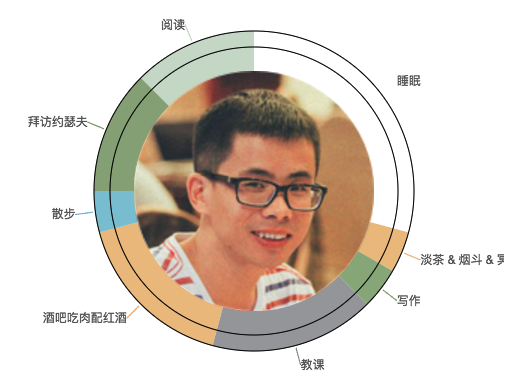
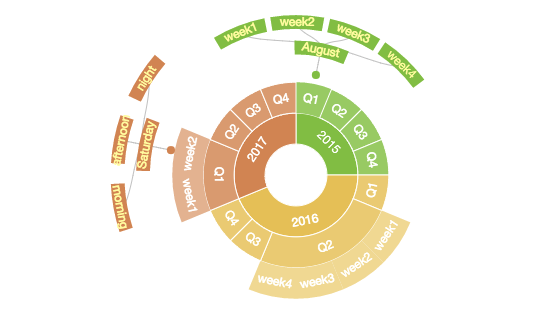
南丁格尔玫瑰图
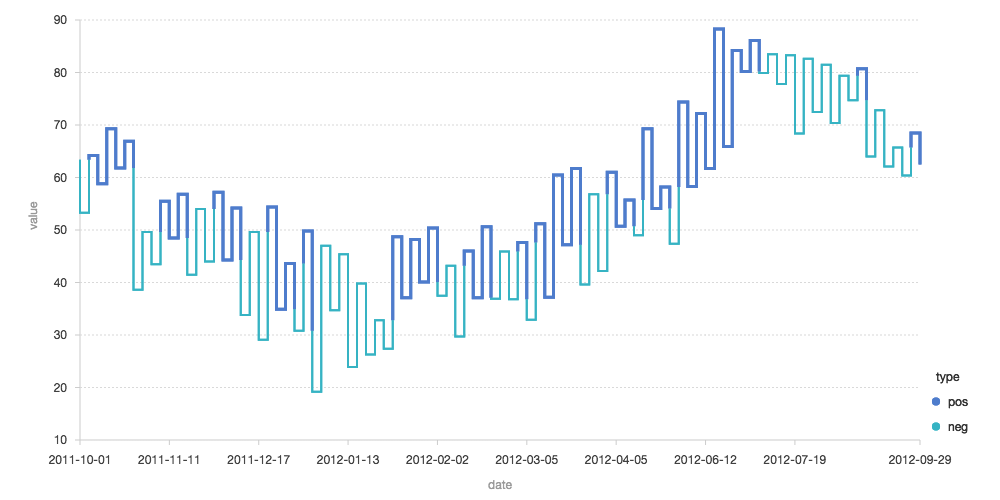
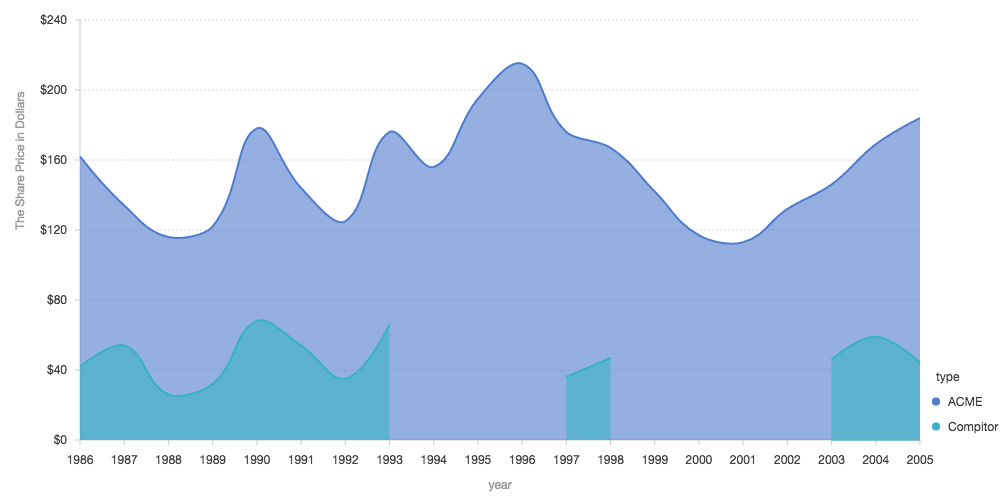
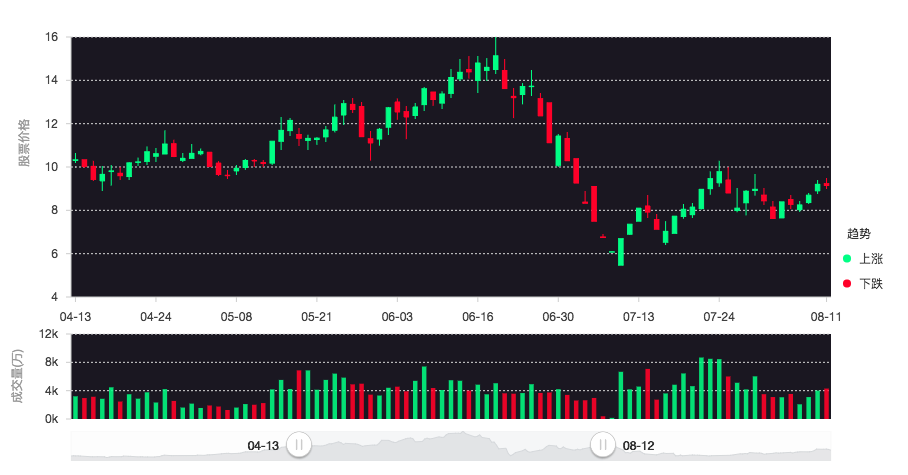
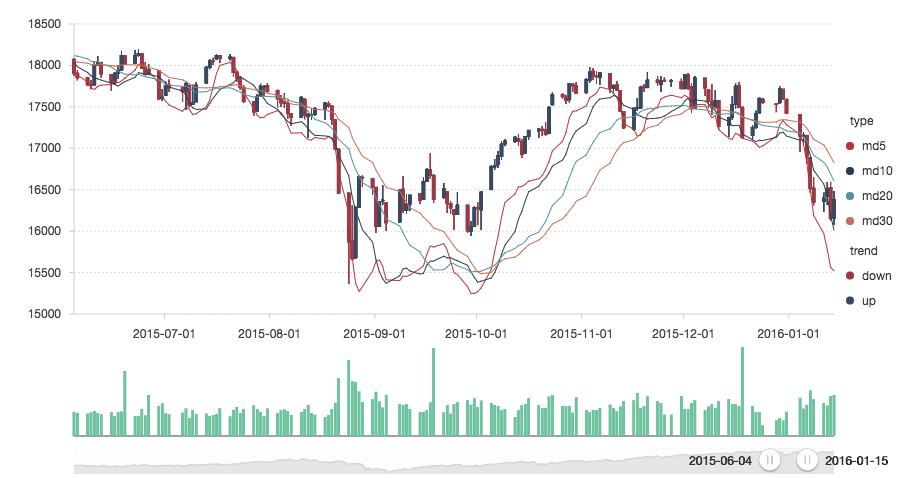
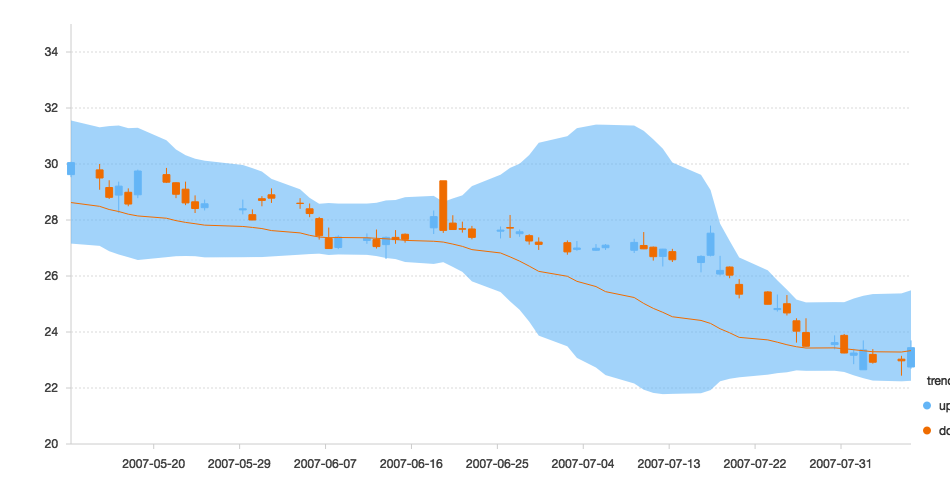
股票图
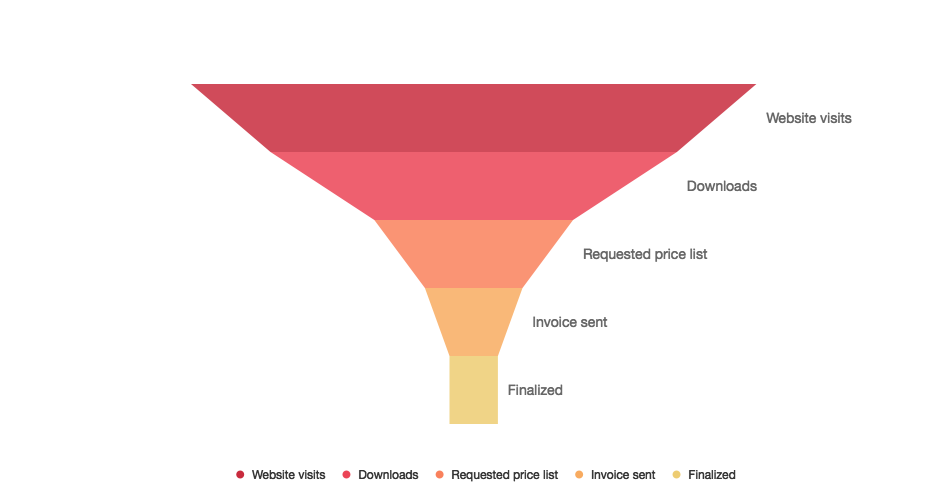
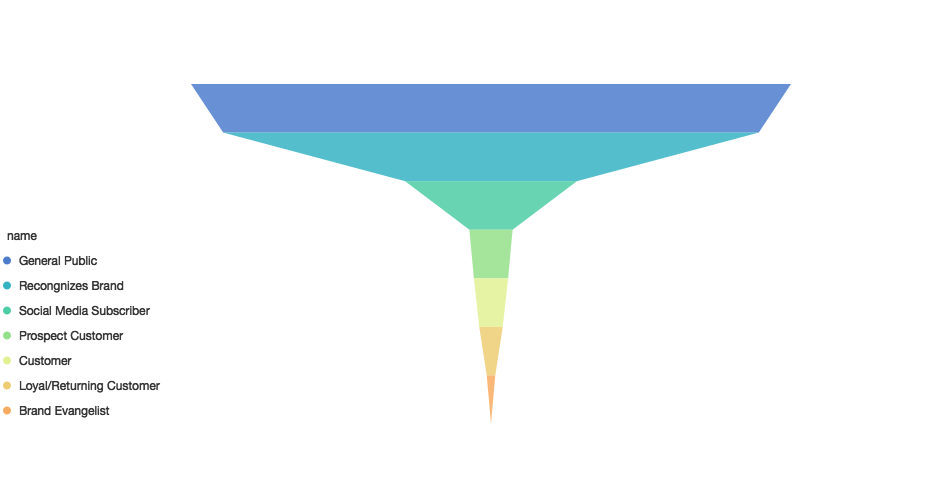
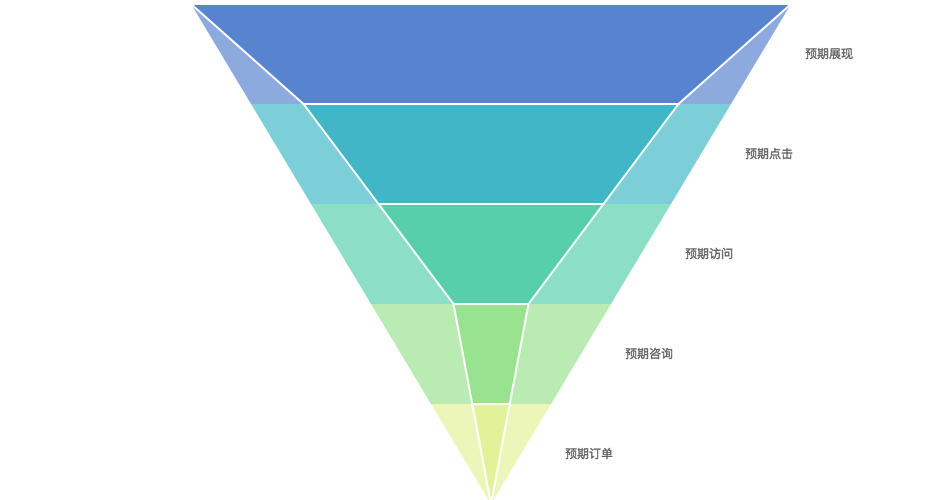
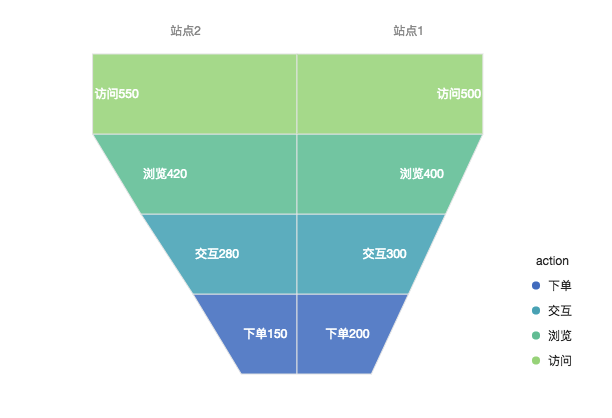
漏斗图
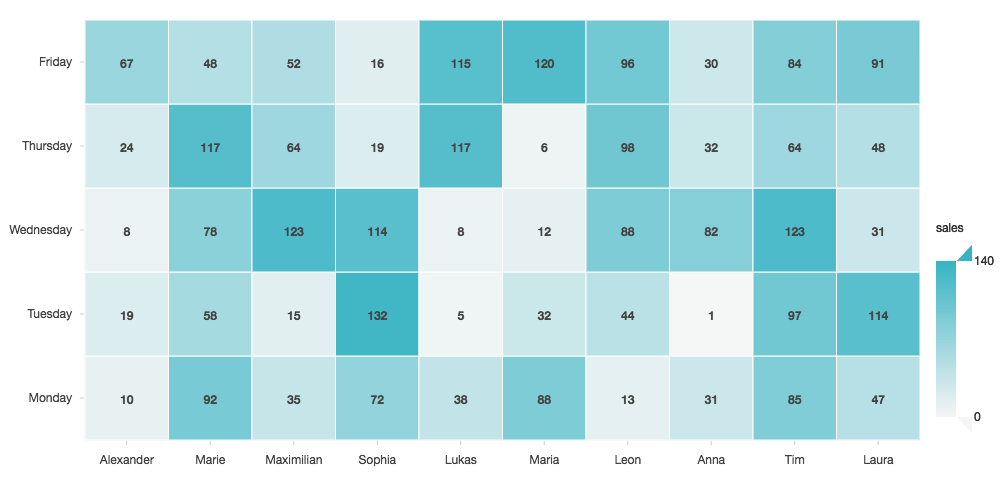
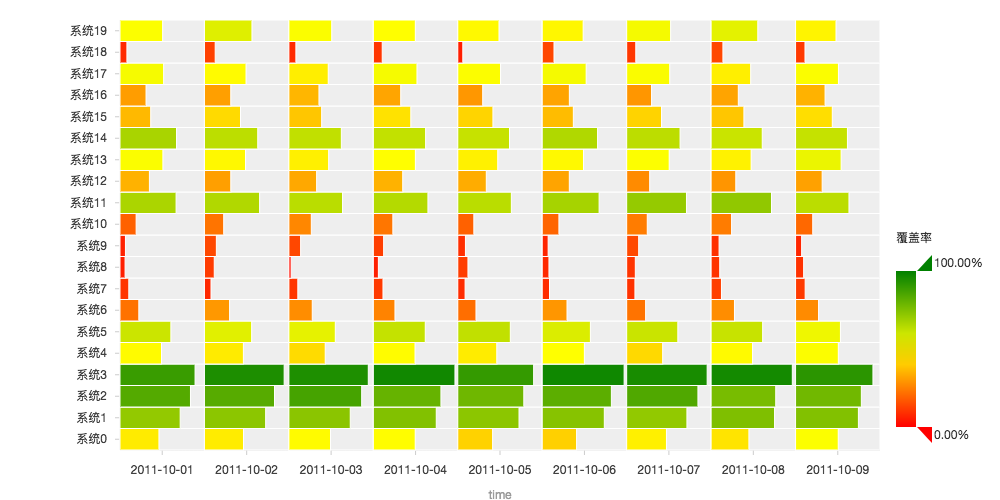
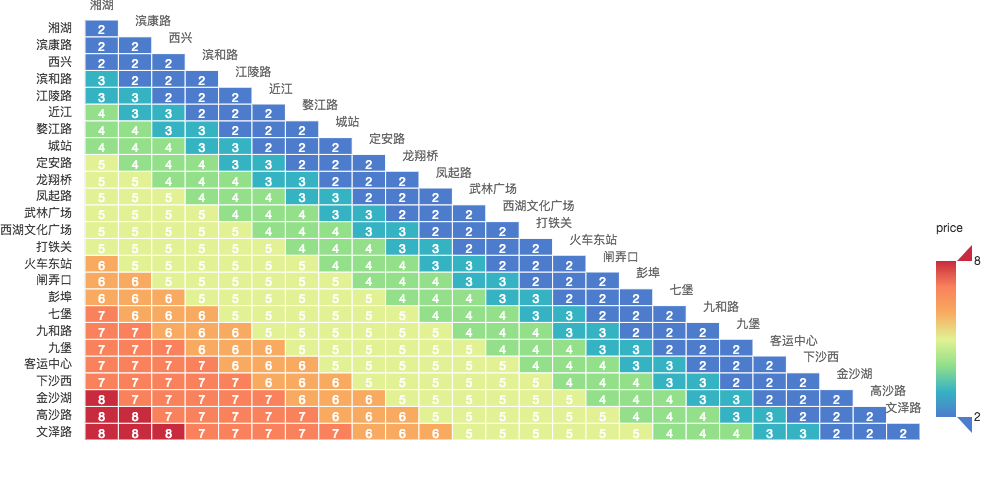
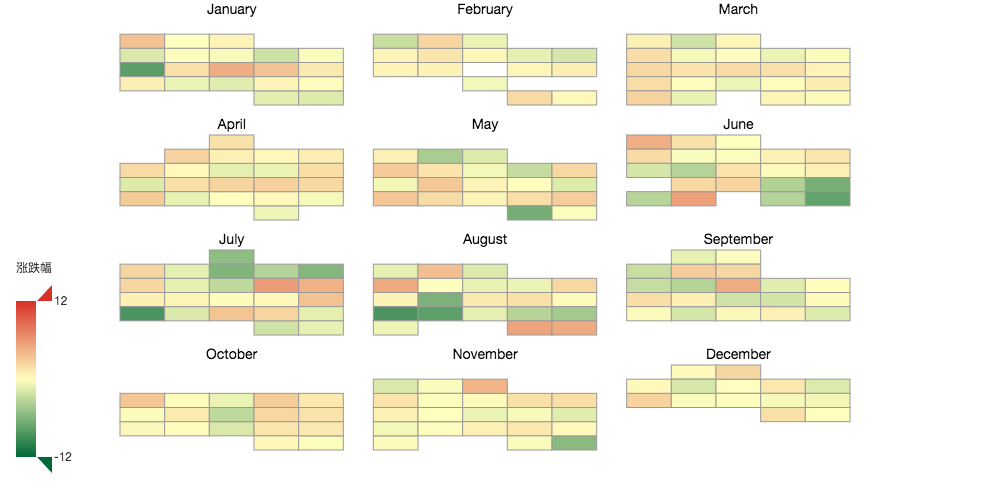
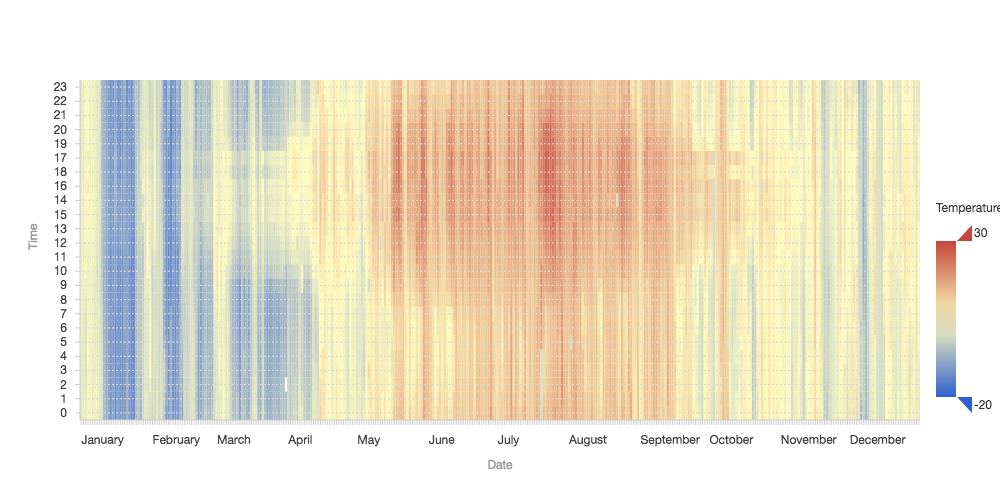
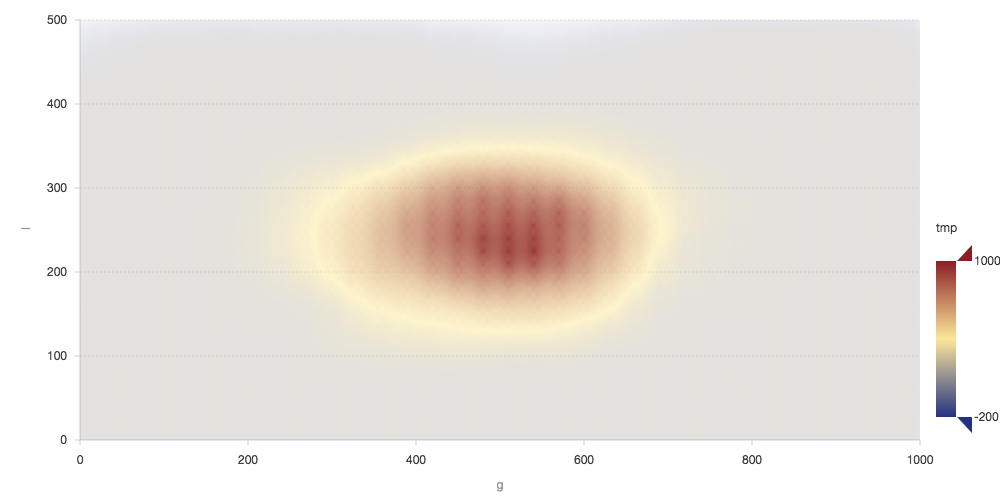
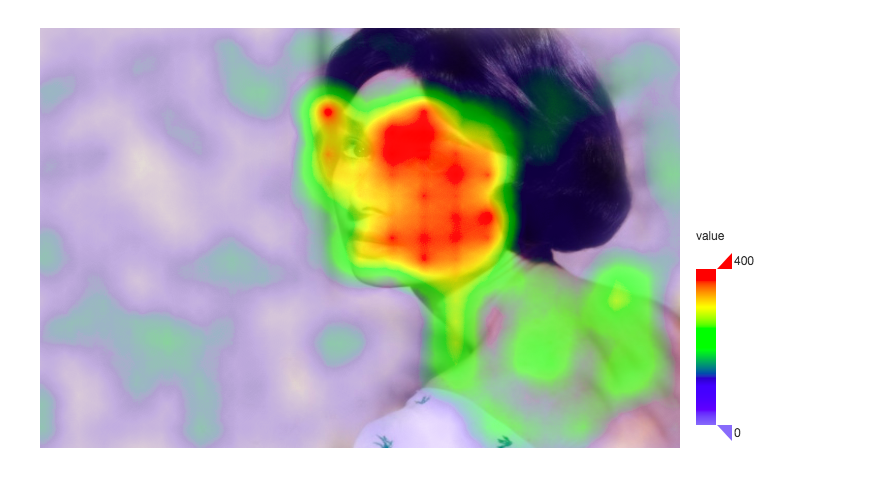
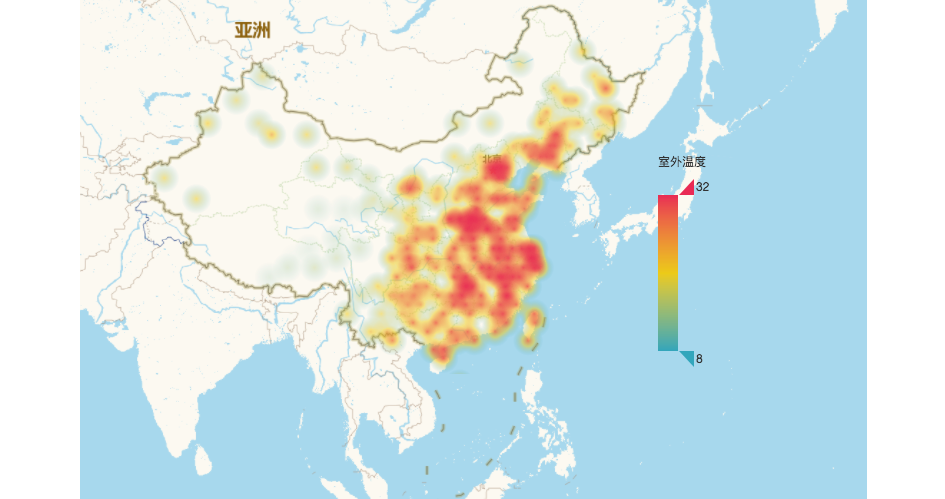
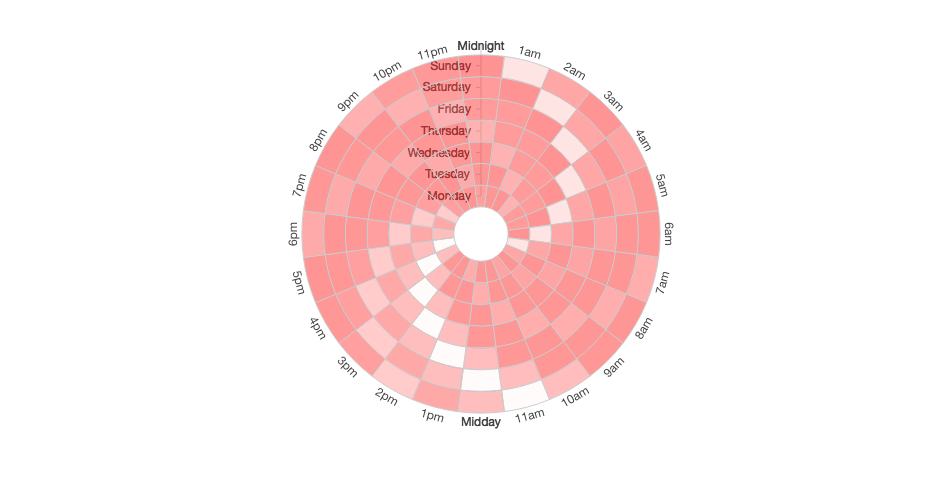
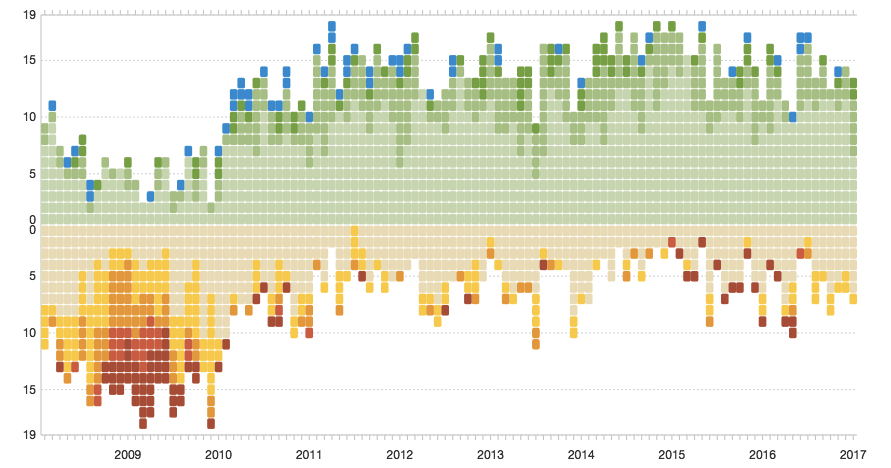
热力或色块图
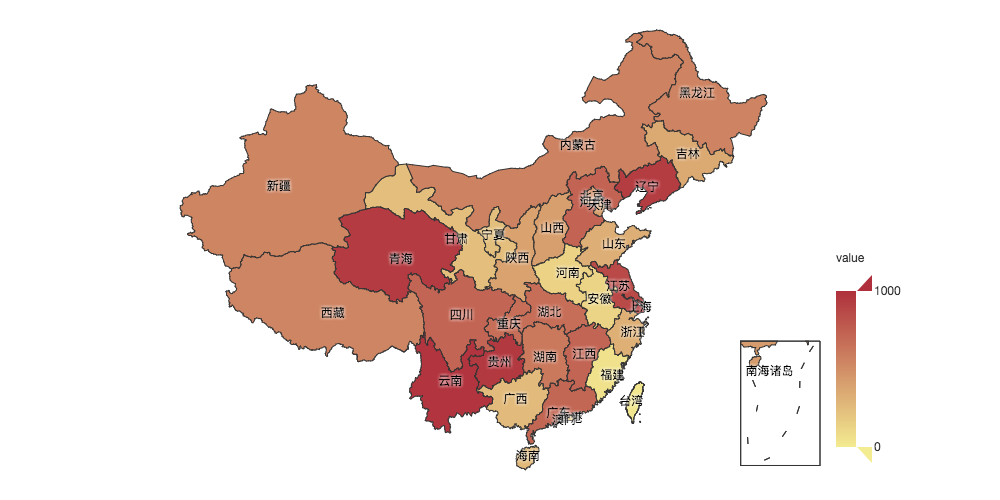
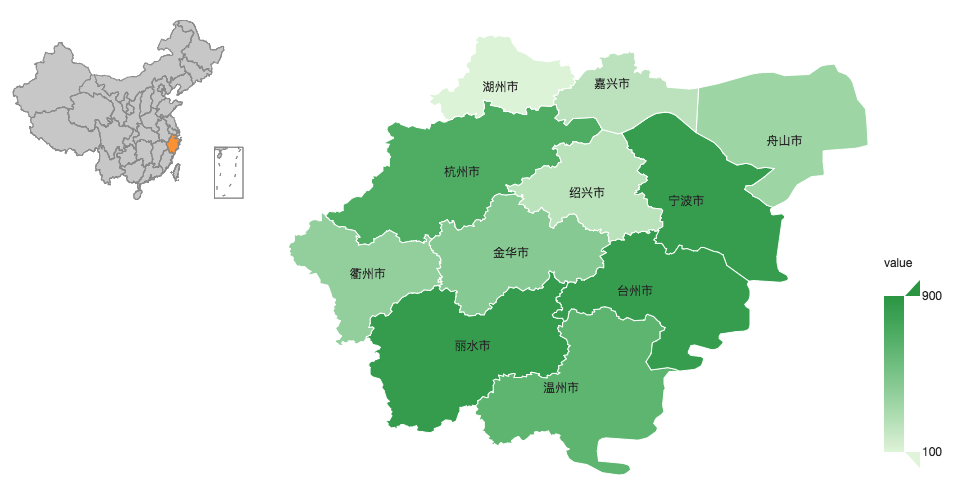
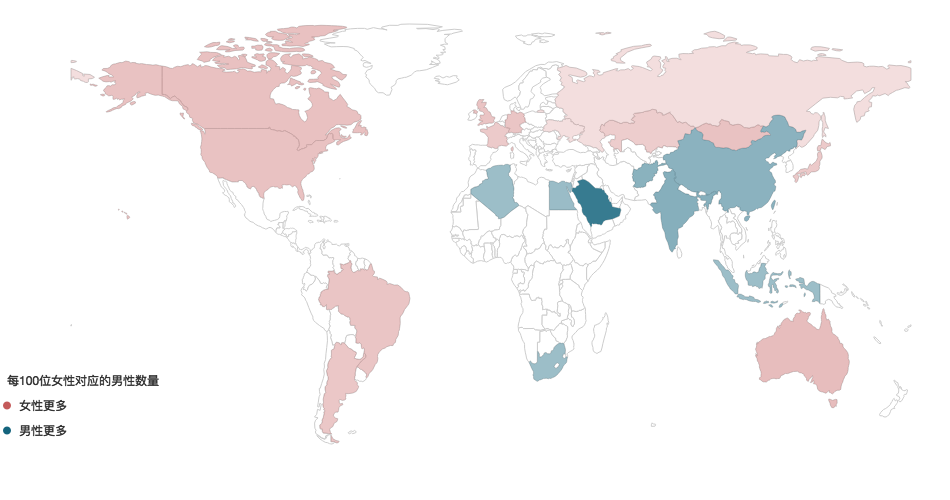
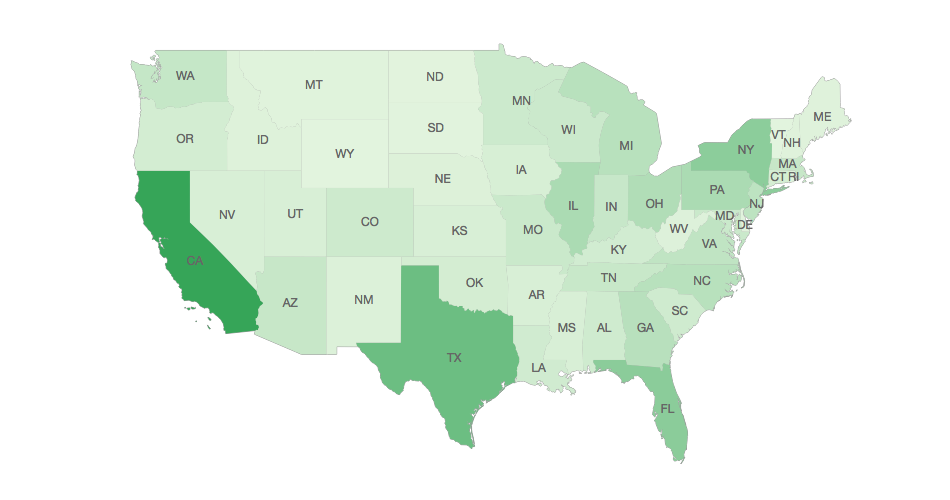
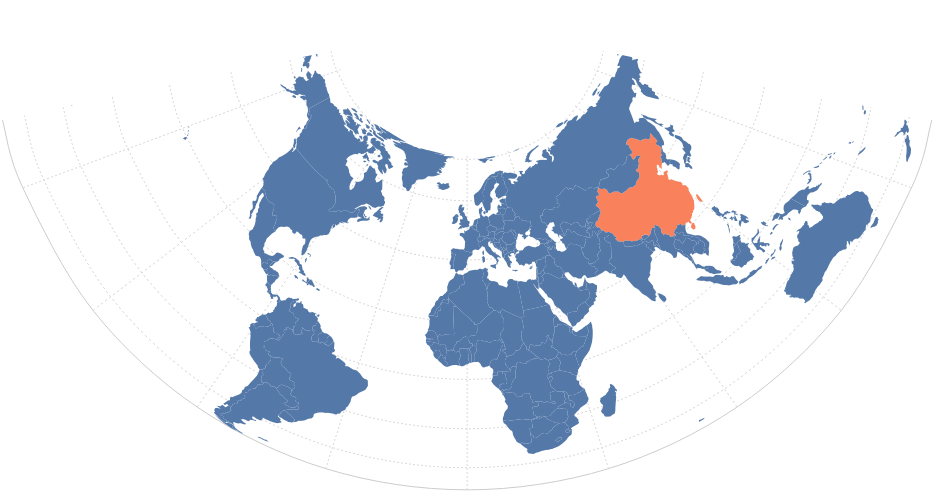
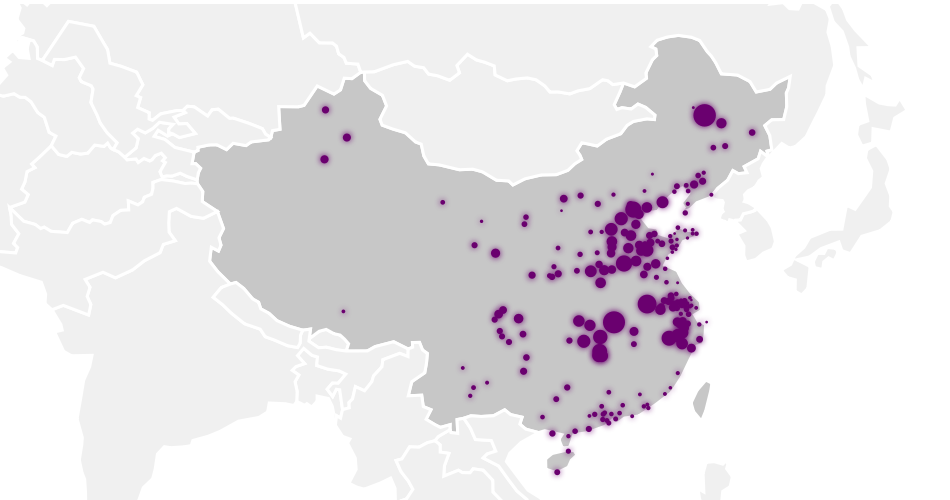
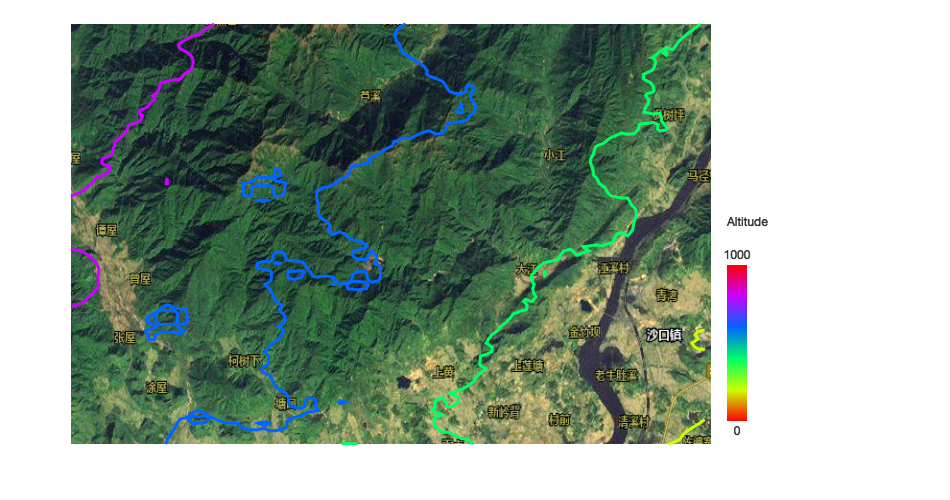
地图
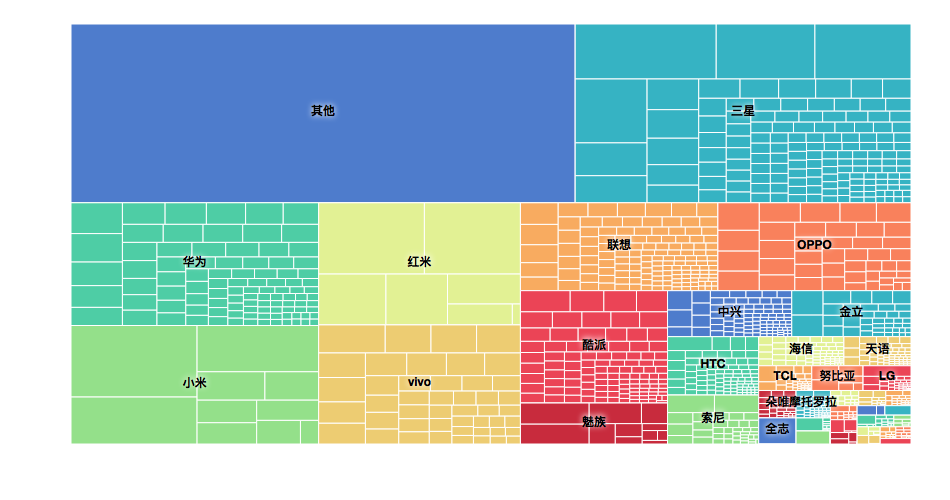
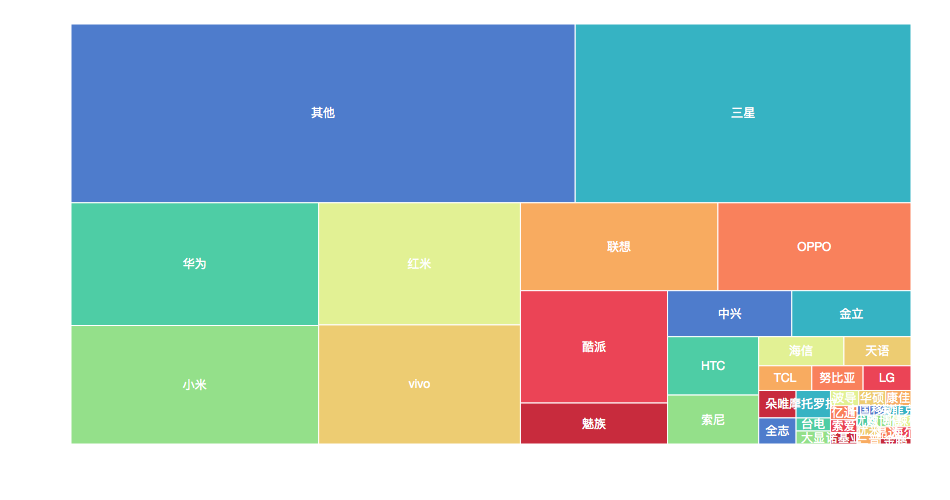
treemap
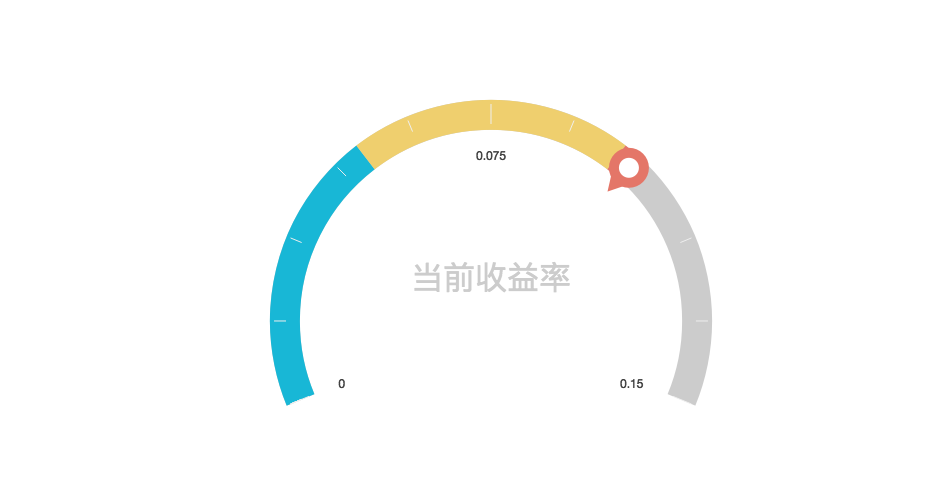
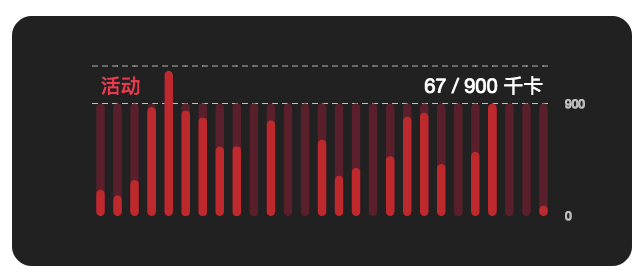
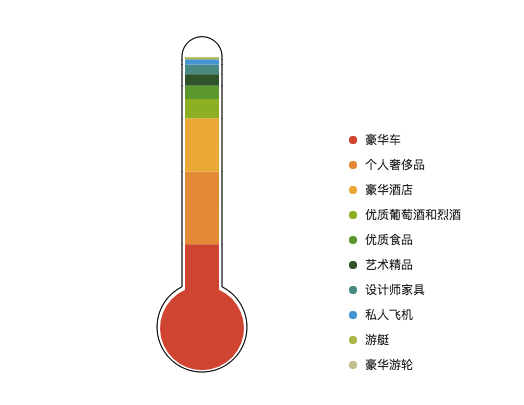
仪表盘
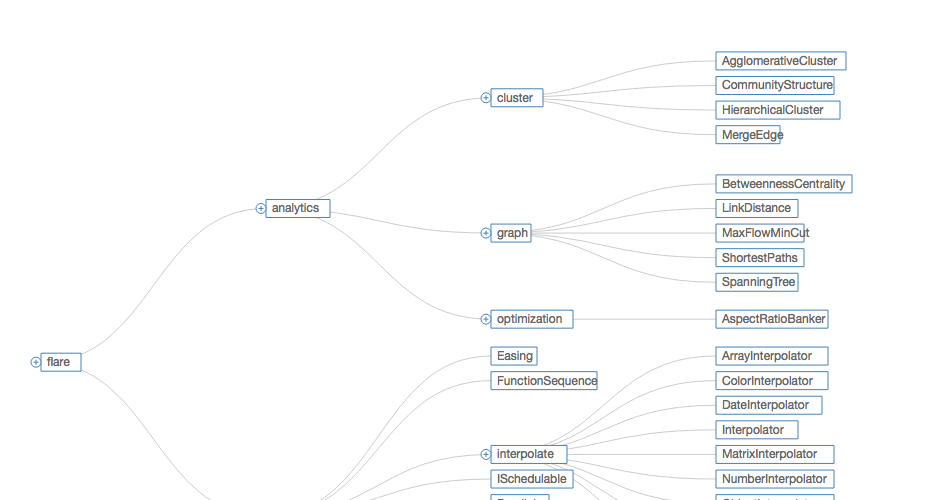
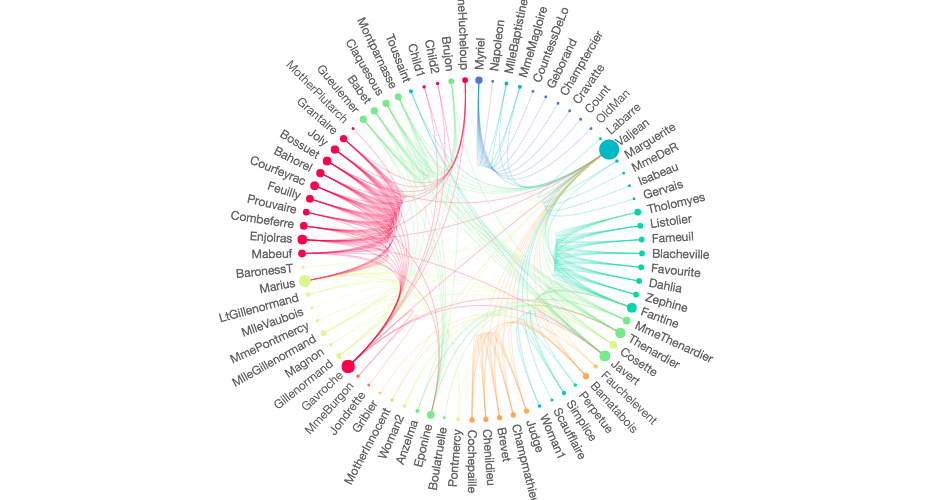
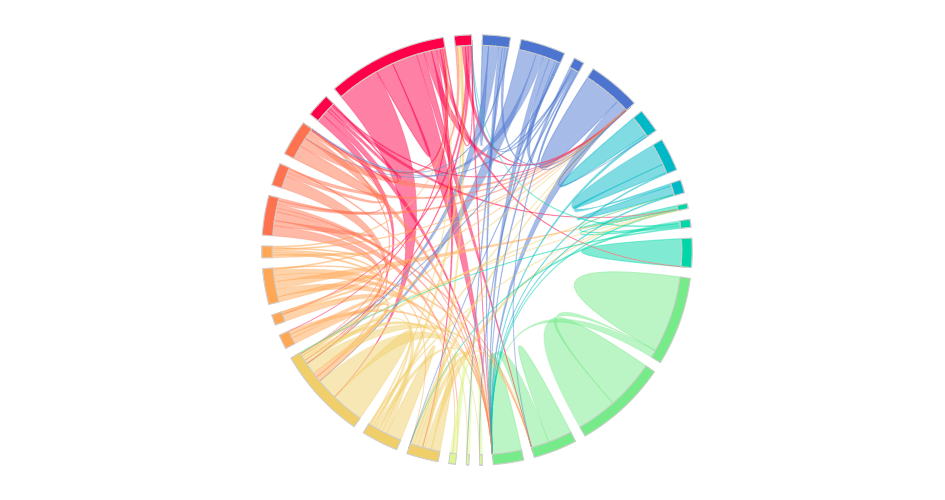
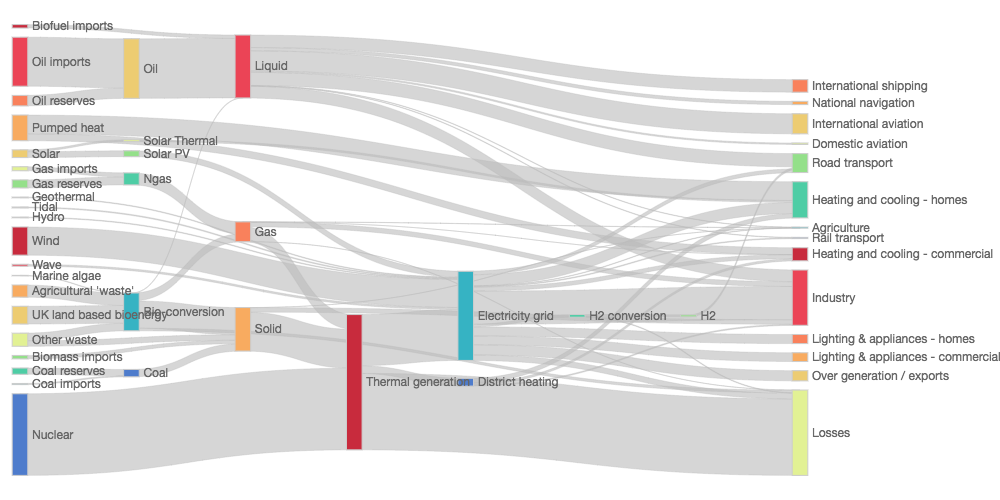
关系图
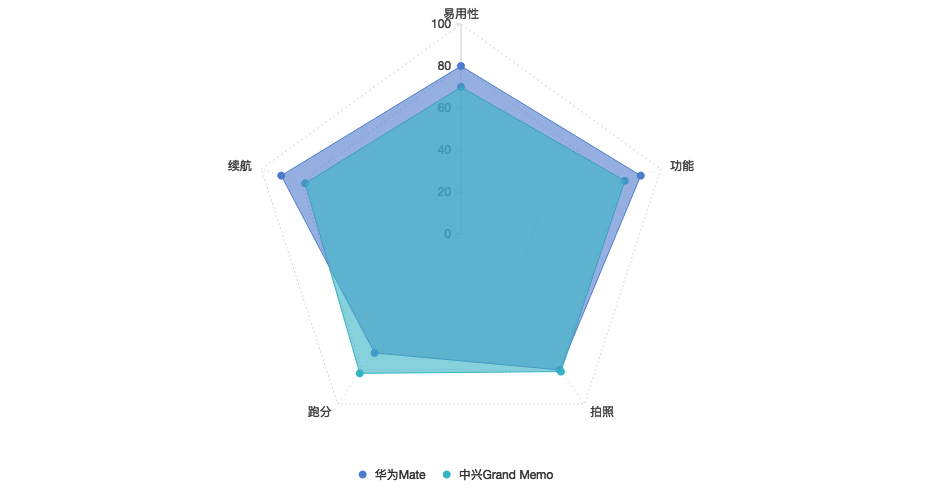
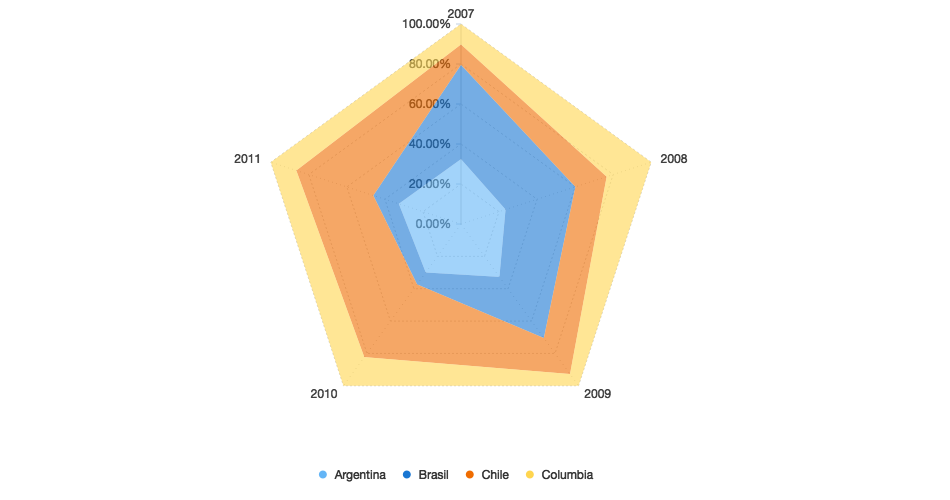
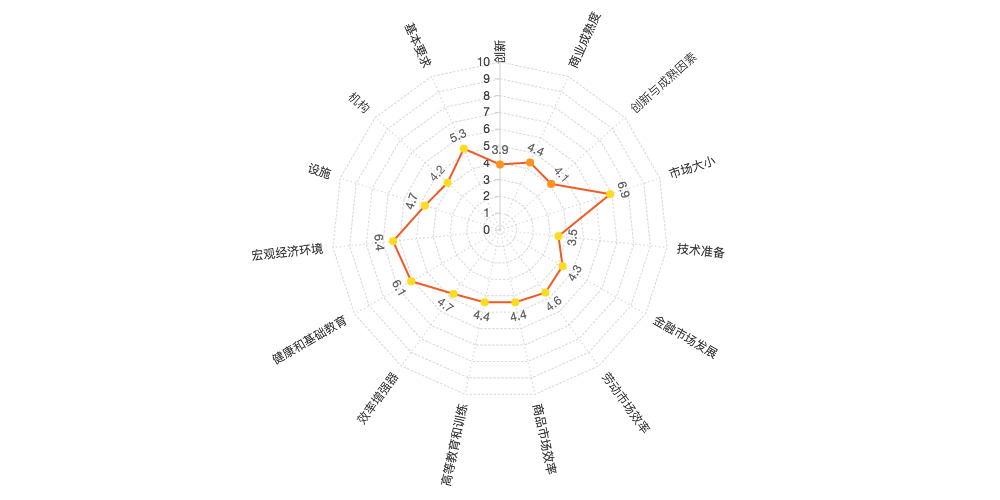
雷达图
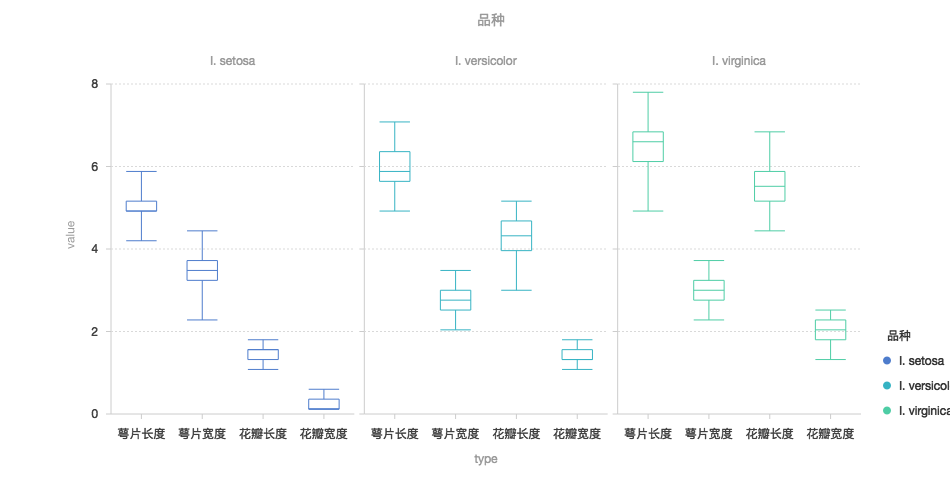
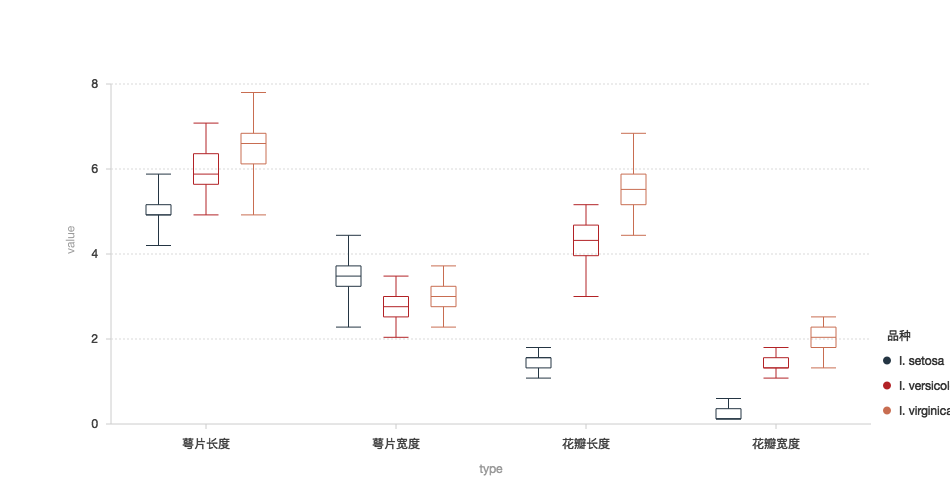
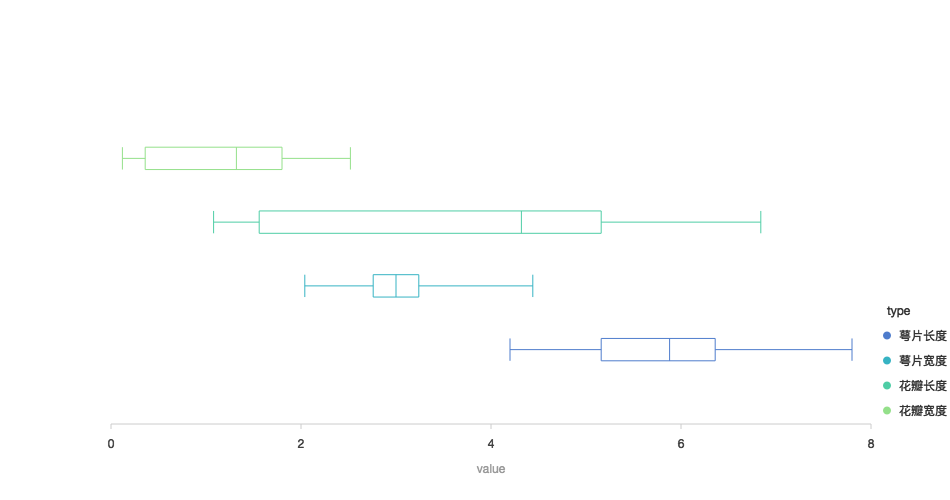
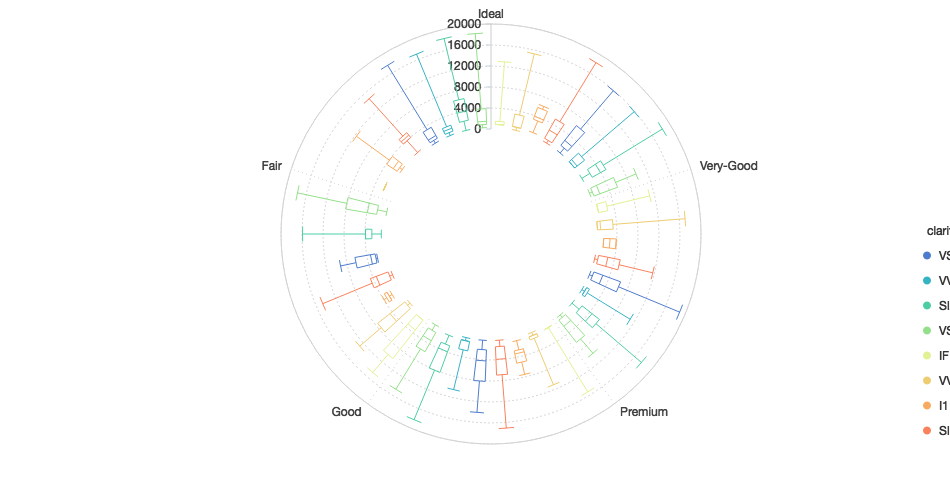
箱型图
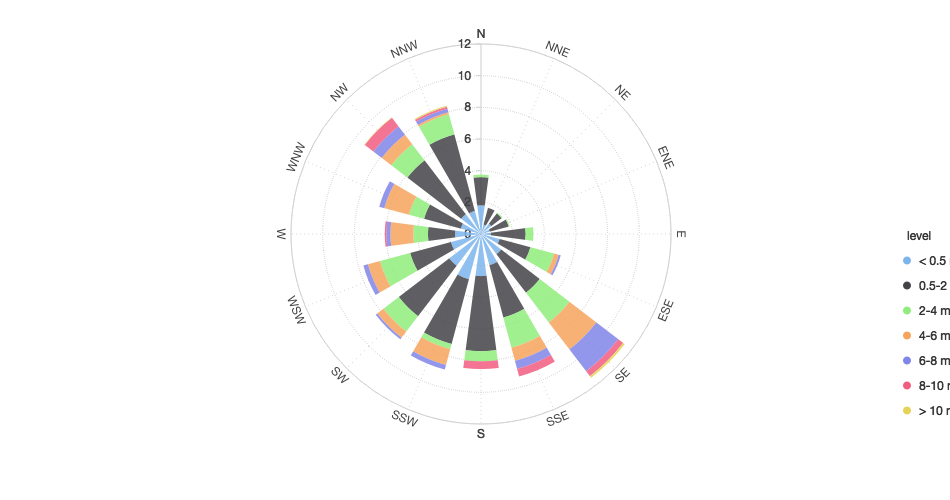
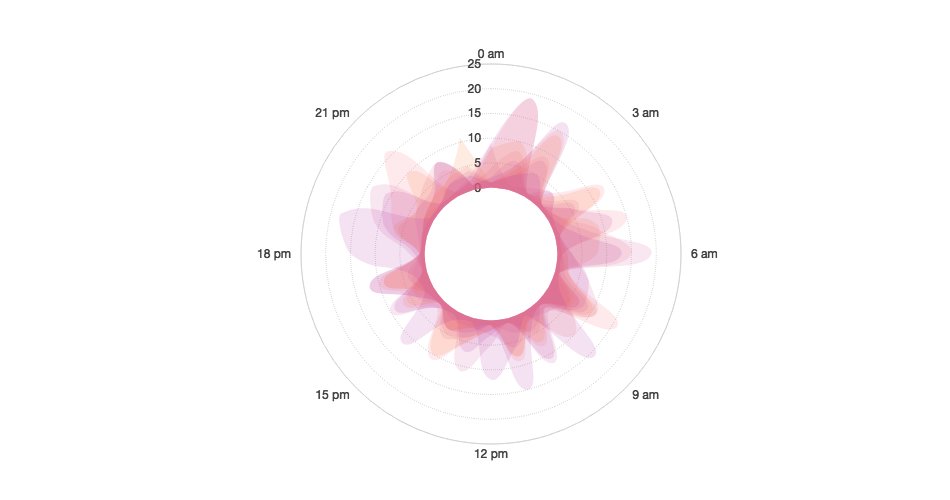
极坐标
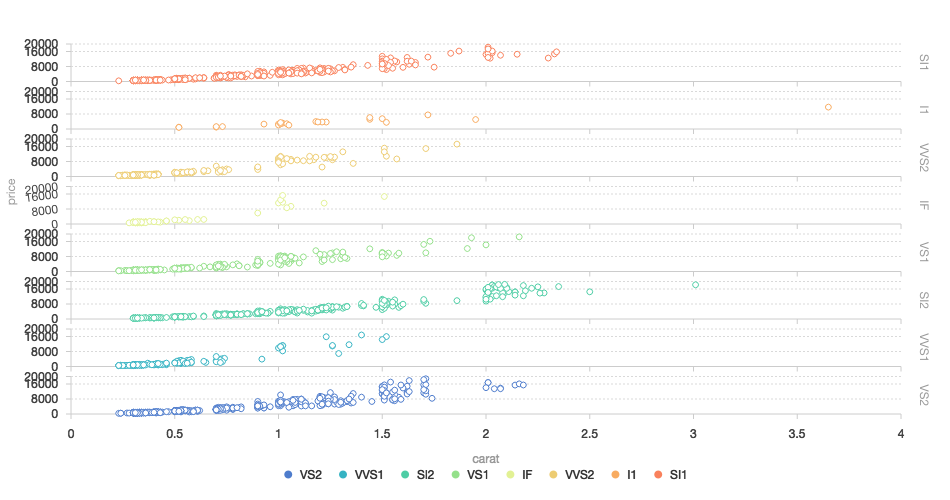
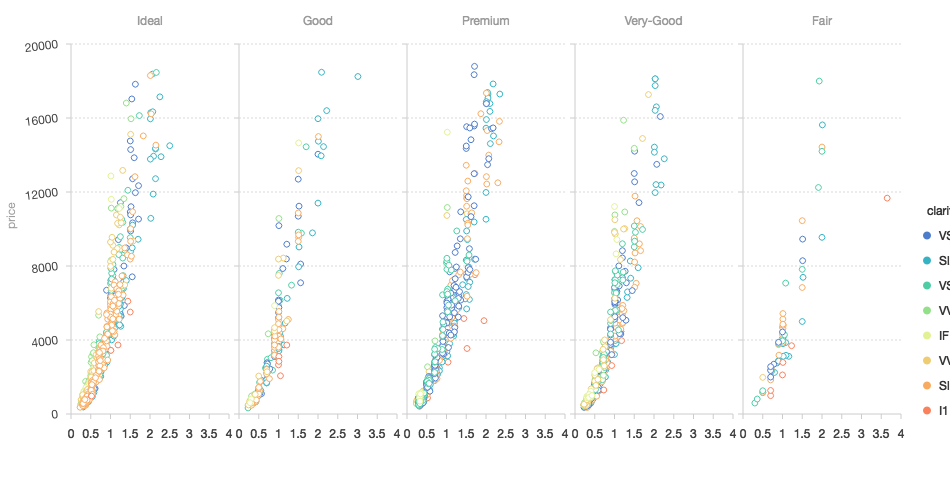
分面
其他图表
gallery
源码
g2-react
运行
复制
<!DOCTYPE html> <html> <head> <meta charset="utf-8"> <title>各国脂肪和糖分摄入量对比</title> <script src="https://a.alipayobjects.com/jquery/jquery/1.11.1/jquery.js"></script> <script src="https://gw.alipayobjects.com/as/g/datavis/g2/2.3.13/index.js"></script> </head> <body> <div id="c1"></div> <script> $('<h2 style="text-align: center;margin-bottom: 5px;">Sugar and fat intake per country</h2>').appendTo($('#c1')) // 设置鼠标 hove 至气泡的样式 G2.Global.activeShape.point = { lineWidth: 2, shadowBlur: 12, shadowColor: '#3182bd' }; var data = [ { x: 95, y: 95, z: 13.8, name: 'BE', country: 'Belgium' }, { x: 86.5, y: 102.9, z: 14.7, name: 'DE', country: 'Germany' }, { x: 80.8, y: 91.5, z: 15.8, name: 'FI', country: 'Finland' }, { x: 80.4, y: 102.5, z: 12, name: 'NL', country: 'Netherlands' }, { x: 80.3, y: 86.1, z: 11.8, name: 'SE', country: 'Sweden' }, { x: 78.4, y: 70.1, z: 16.6, name: 'ES', country: 'Spain' }, { x: 74.2, y: 68.5, z: 14.5, name: 'FR', country: 'France' }, { x: 73.5, y: 83.1, z: 10, name: 'NO', country: 'Norway' }, { x: 71, y: 93.2, z: 24.7, name: 'UK', country: 'United Kingdom' }, { x: 69.2, y: 57.6, z: 10.4, name: 'IT', country: 'Italy' }, { x: 68.6, y: 20, z: 16, name: 'RU', country: 'Russia' }, { x: 65.5, y: 126.4, z: 35.3, name: 'US', country: 'United States' }, { x: 65.4, y: 50.8, z: 28.5, name: 'HU', country: 'Hungary' }, { x: 63.4, y: 51.8, z: 15.4, name: 'PT', country: 'Portugal' }, { x: 64, y: 82.9, z: 31.3, name: 'NZ', country: 'New Zealand' } ]; var chart = new G2.Chart({ id: 'c1', forceFit: true, height: 450, plotCfg: { margin: [20, 80, 90, 60], background: { stroke: '#ccc', // 边颜色 lineWidth: 1, // 边框粗细 } // 绘图区域背景设置 } }); chart.source(data, { x: { alias: 'Daily fat intake', // 定义别名 tickInterval: 5, // 自定义刻度间距 nice: false, // 不对最大最小值优化 max: 96, // 自定义最大值 min: 62 // 自定义最小值 }, y: { alias: 'Daily sugar intake', tickInterval: 50, nice: false, max: 165, min: 0 }, z: { alias: 'Obesity(adults) %' } }); // 开始配置坐标轴 chart.axis('x', { formatter: function(val) { return val + ' gr'; // 格式化坐标轴显示文本 }, grid: { line: { stroke: '#d9d9d9', lineWidth: 1, lineDash: [2,2] } } }); chart.axis('y', { titleOffset: 80, // 设置标题距离坐标轴的距离 formatter: function(val) { if (val > 0) { return val + ' gr'; } } }); chart.legend(false); chart.tooltip({ map: { title: 'country' } }); chart.point().position('x*y').size('z', 40, 10).label('name*country', { offset:0, // 文本距离图形的距离 label: { fill: '#000', fontWeight: 'bold', // 文本粗细 shadowBlur: 5, // 文本阴影模糊 shadowColor: '#fff' // 阴影颜色 }, }).color('#3182bd').opacity(0.5).shape('circle').tooltip('x*y*z'); chart.guide().tag([65, 'min'], [65, 'max'], 'Safe fat intake 65g/day'); chart.guide().tag(['min', 50], ['max', 50], 'Safe sugar intake 50g/day'); chart.render(); </script> </body> </html>
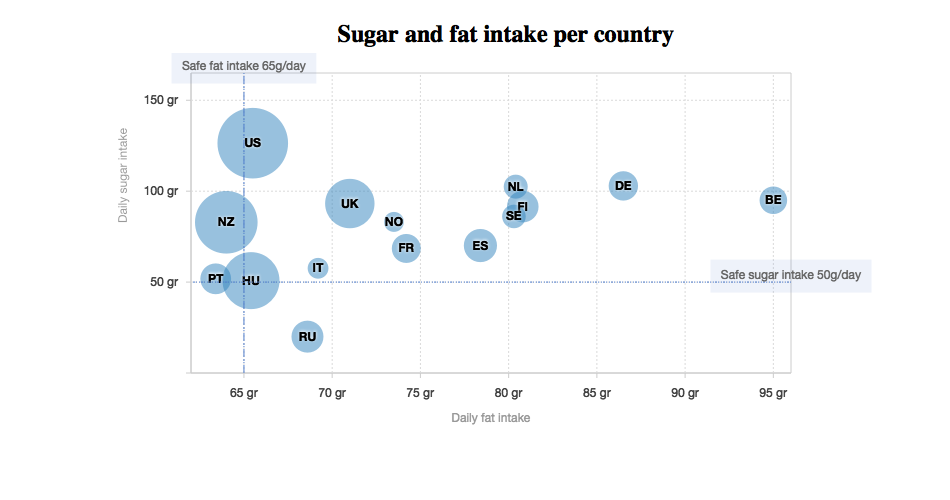
各国脂肪和糖分摄入量对比
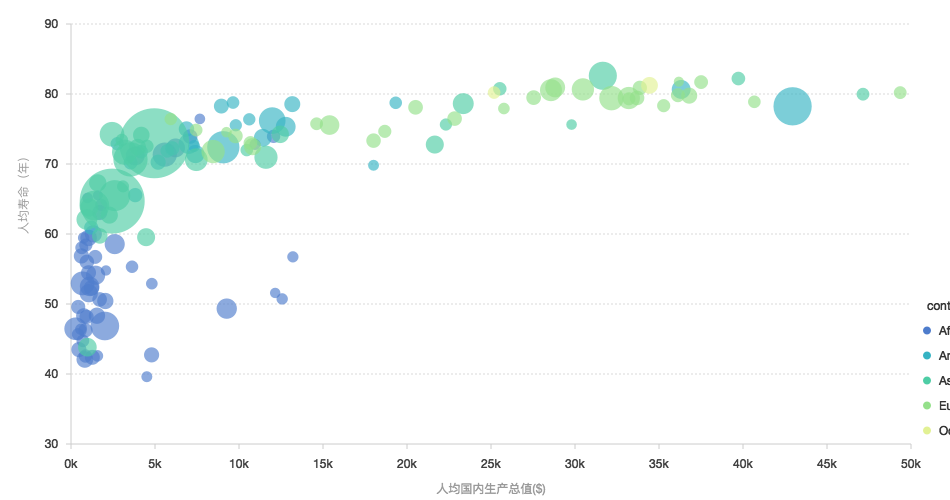
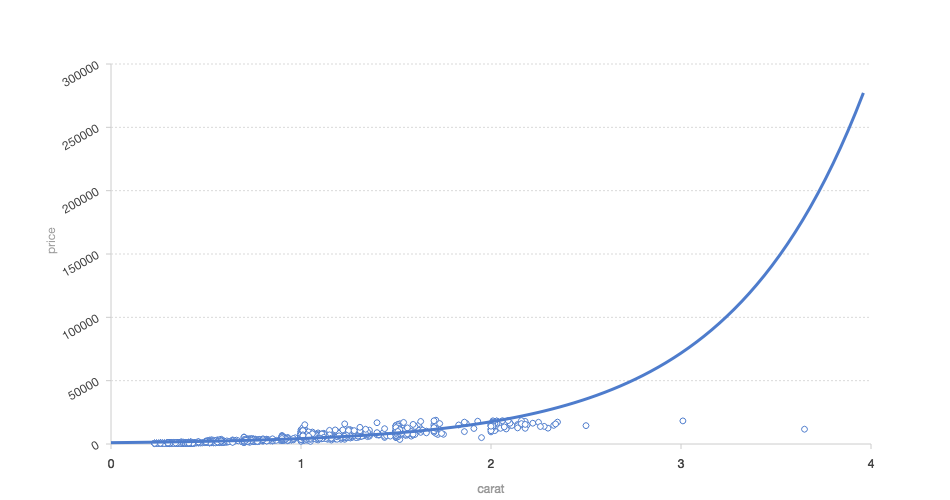
气泡图是一种多变量图表,是散点图的变体,也可以认为是散点图和百分比区域图的组合。
了解更多
<!DOCTYPE html> <html> <head> <meta charset="utf-8"> <title>各国脂肪和糖分摄入量对比</title> <script src="https://unpkg.com/react@15/dist/react.min.js"></script> <script src="https://unpkg.com/react-dom@15/dist/react-dom.min.js"></script> <script src="https://a.alipayobjects.com/g/datavis/g2/2.3.13/g2.js"></script> <script src="https://unpkg.com/g2-react@1.2.0/dist/index.js"></script> <script src="https://cdn.bootcss.com/babel-core/5.8.38/browser.min.js"></script> <script src="https://unpkg.com/axios/dist/axios.min.js"></script> </head> <body> <div id="c1"></div> <script type="text/babel"> // 设置鼠标 hove 至气泡的样式 G2.Global.activeShape.point = { lineWidth: 2, shadowBlur: 12, shadowColor: '#3182bd' }; const data = [ { x: 95, y: 95, z: 13.8, name: 'BE', country: 'Belgium' }, { x: 86.5, y: 102.9, z: 14.7, name: 'DE', country: 'Germany' }, { x: 80.8, y: 91.5, z: 15.8, name: 'FI', country: 'Finland' }, { x: 80.4, y: 102.5, z: 12, name: 'NL', country: 'Netherlands' }, { x: 80.3, y: 86.1, z: 11.8, name: 'SE', country: 'Sweden' }, { x: 78.4, y: 70.1, z: 16.6, name: 'ES', country: 'Spain' }, { x: 74.2, y: 68.5, z: 14.5, name: 'FR', country: 'France' }, { x: 73.5, y: 83.1, z: 10, name: 'NO', country: 'Norway' }, { x: 71, y: 93.2, z: 24.7, name: 'UK', country: 'United Kingdom' }, { x: 69.2, y: 57.6, z: 10.4, name: 'IT', country: 'Italy' }, { x: 68.6, y: 20, z: 16, name: 'RU', country: 'Russia' }, { x: 65.5, y: 126.4, z: 35.3, name: 'US', country: 'United States' }, { x: 65.4, y: 50.8, z: 28.5, name: 'HU', country: 'Hungary' }, { x: 63.4, y: 51.8, z: 15.4, name: 'PT', country: 'Portugal' }, { x: 64, y: 82.9, z: 31.3, name: 'NZ', country: 'New Zealand' } ]; const Chart = createG2(chart => { chart.col('x', { alias: 'Daily fat intake', // 定义别名 tickInterval: 5, // 自定义刻度间距 nice: false, // 不对最大最小值优化 max: 96, // 自定义最大值 min: 62 // 自定义最小值 }); chart.col('y', { alias: 'Daily sugar intake', tickInterval: 50, nice: false, max: 165, min: 0 }); chart.col('z', { alias: 'Obesity(adults) %' }); // 开始配置坐标轴 chart.axis('x', { formatter: function(val) { return val + ' gr'; // 格式化坐标轴显示文本 }, grid: { line: { stroke: '#d9d9d9', lineWidth: 1, lineDash: [2,2] } } }); chart.axis('y', { titleOffset: 80, // 设置标题距离坐标轴的距离 formatter: function(val) { if (val > 0) { return val + ' gr'; } } }); chart.legend(false); chart.tooltip({ map: { title: 'country' } }); chart.point().position('x*y').size('z', 40, 10).label('name*country', { offset:0, // 文本距离图形的距离 label: { fill: '#000', fontWeight: 'bold', // 文本粗细 shadowBlur: 5, // 文本阴影模糊 shadowColor: '#fff' // 阴影颜色 }, }).color('#3182bd').opacity(0.5).shape('circle').tooltip('x*y*z'); chart.guide().tag([65, 'min'], [65, 'max'], 'Safe fat intake 65g/day'); chart.guide().tag(['min', 50], ['max', 50], 'Safe sugar intake 50g/day'); chart.render(); }); const MyComponent = React.createClass({ getInitialState() { return { data: data, forceFit: true, width: 500, height: 450, plotCfg: { margin: [20, 80, 90, 60], background: { stroke: '#ccc', // 边颜色 lineWidth: 1, // 边框粗细 } // 绘图区域背景设置 } }; }, render() { return ( <div> <Chart data={this.state.data} width={this.state.width} height={this.state.height} plotCfg={this.state.plotCfg} forceFit={this.state.forceFit} /> </div> ); } }); ReactDOM.render(<MyComponent />, document.getElementById('c1')); </script> </body> </html>