G2
图表示例
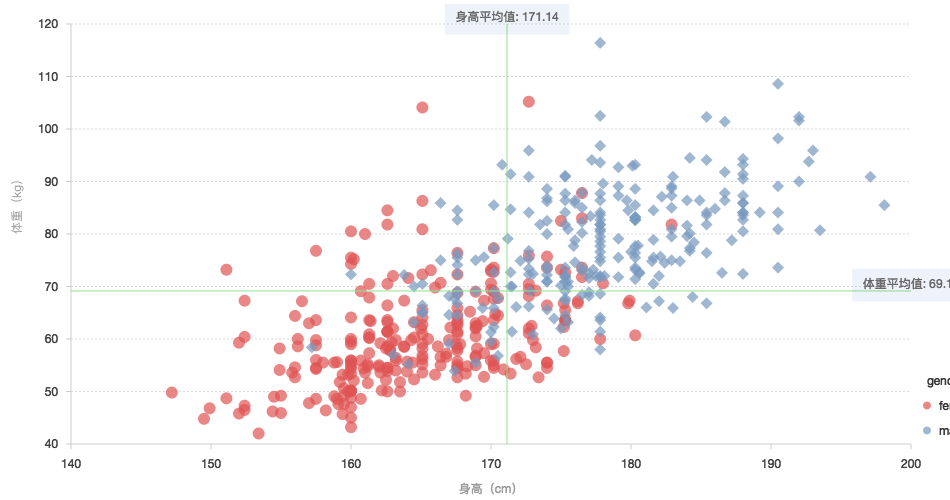
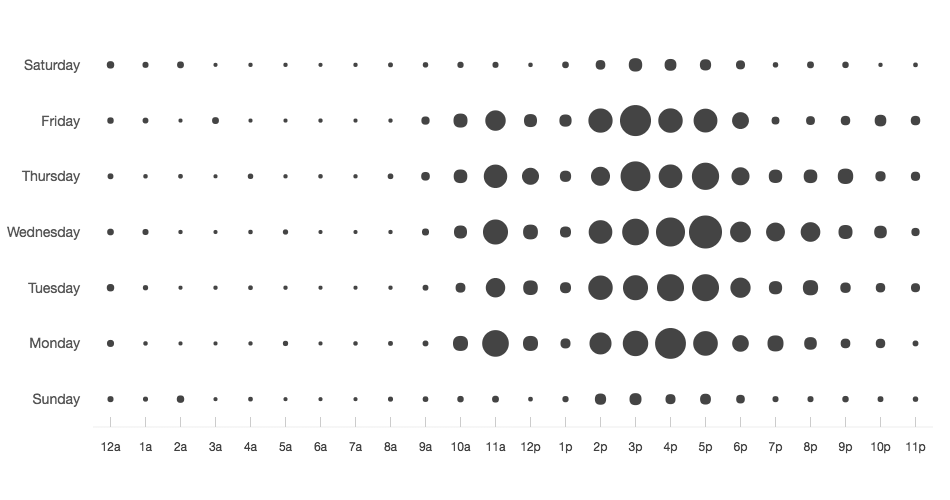
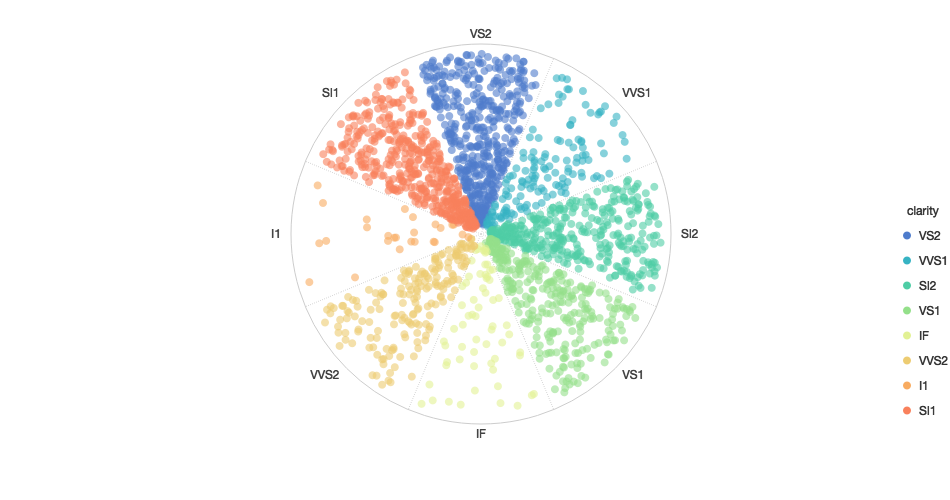
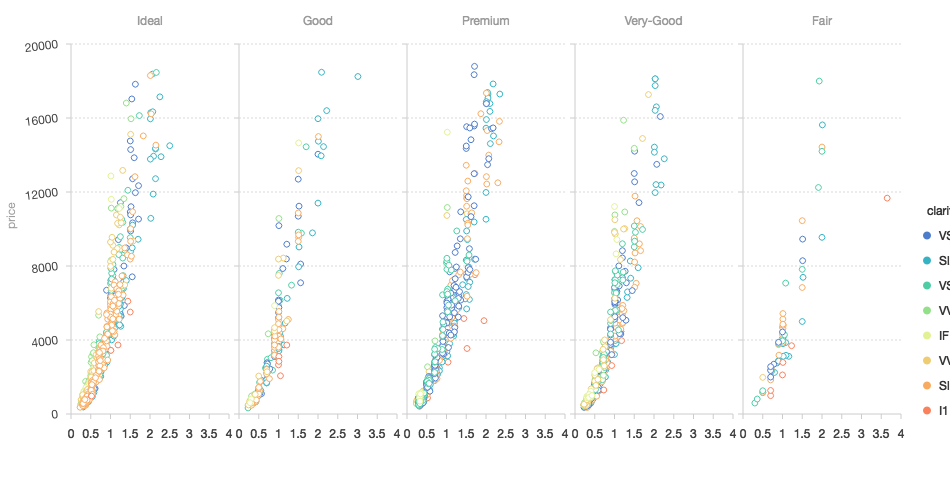
点图
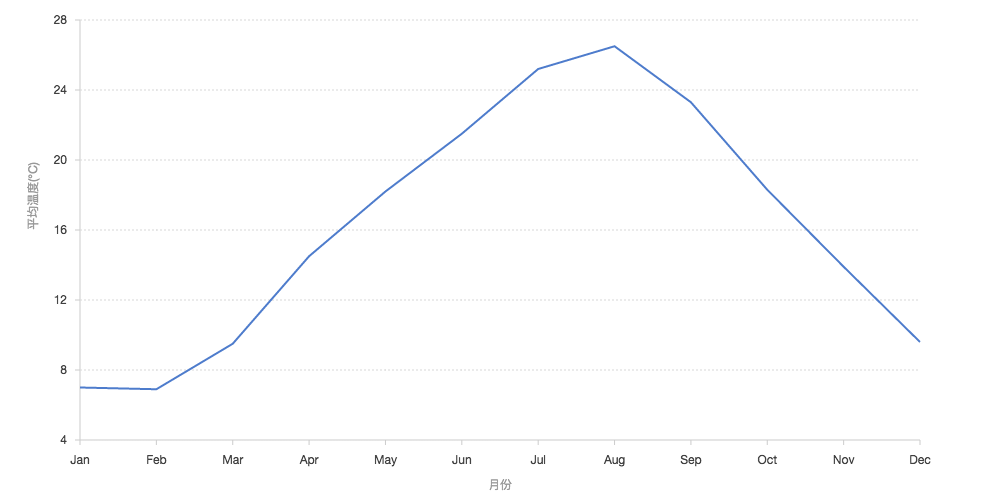
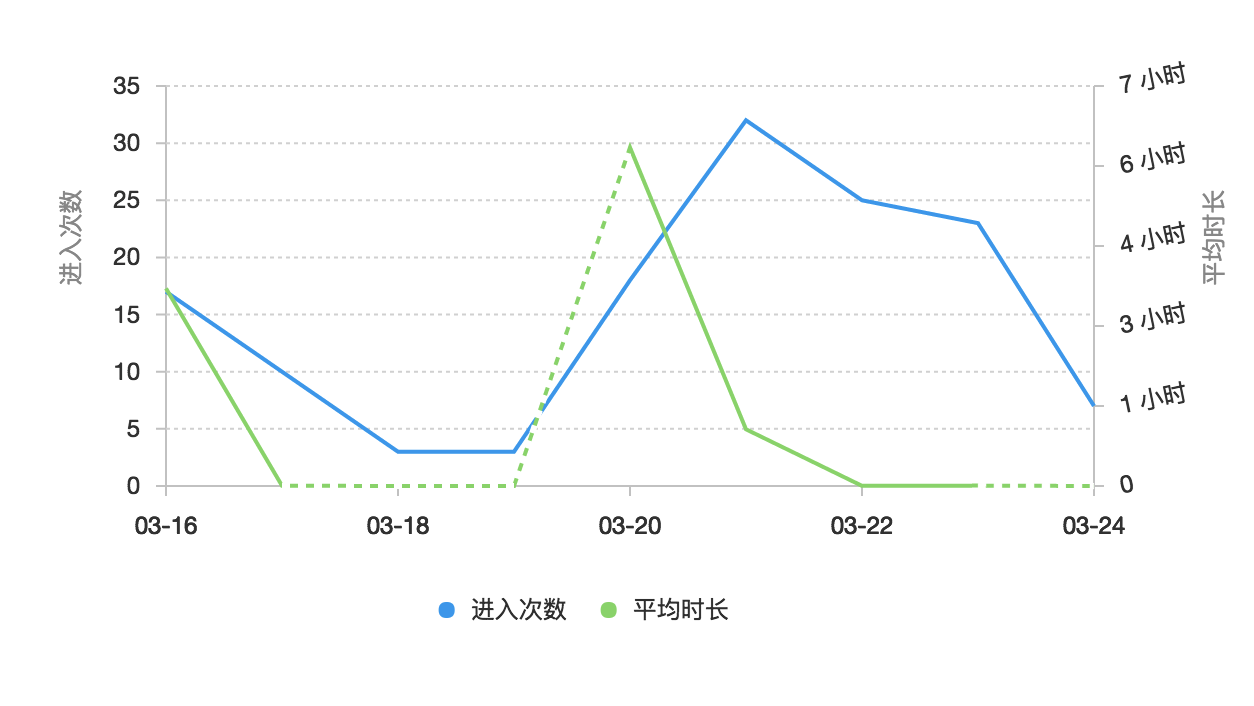
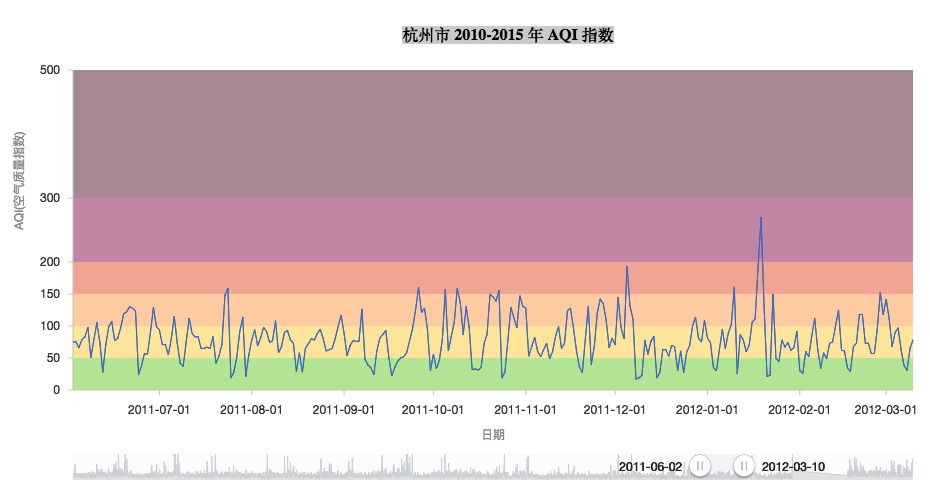
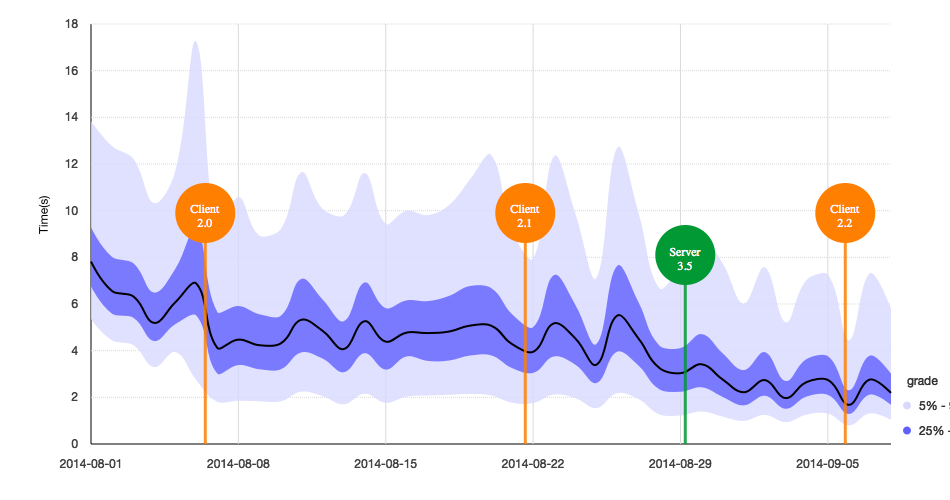
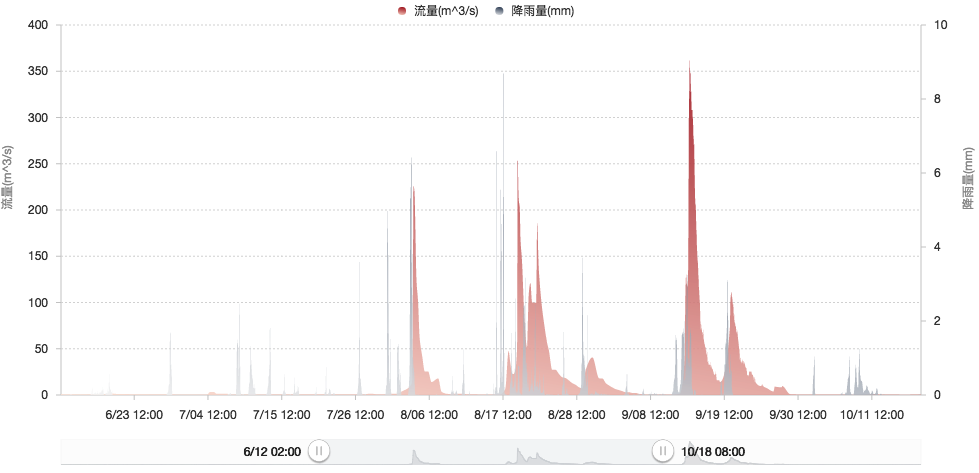
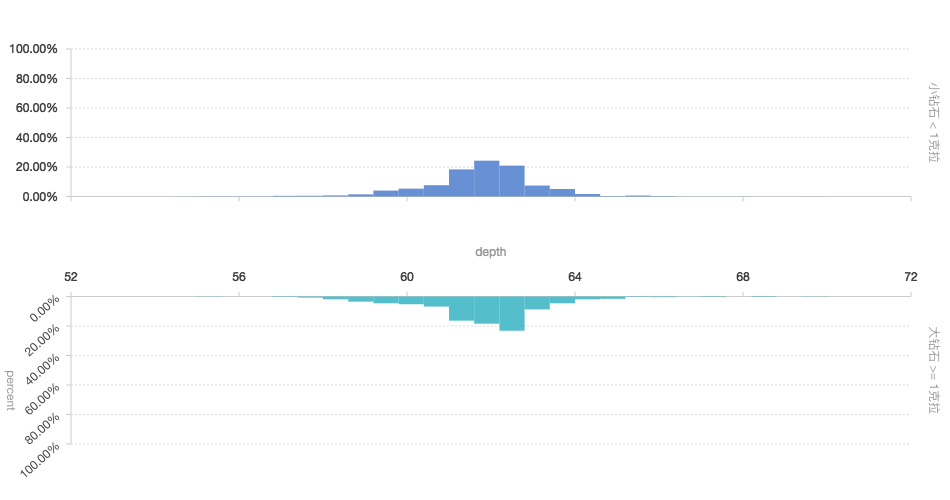
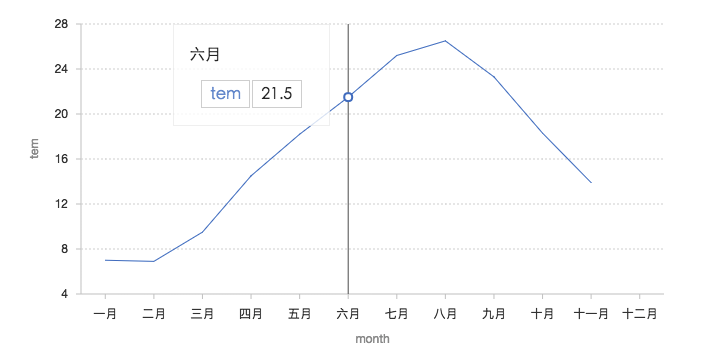
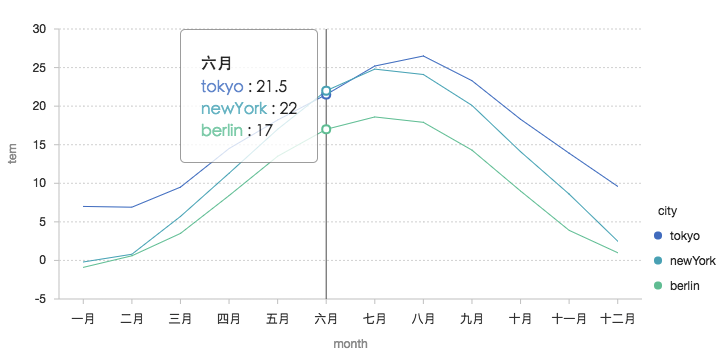
线图
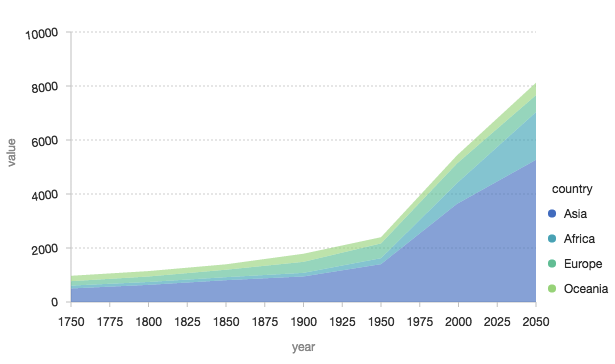
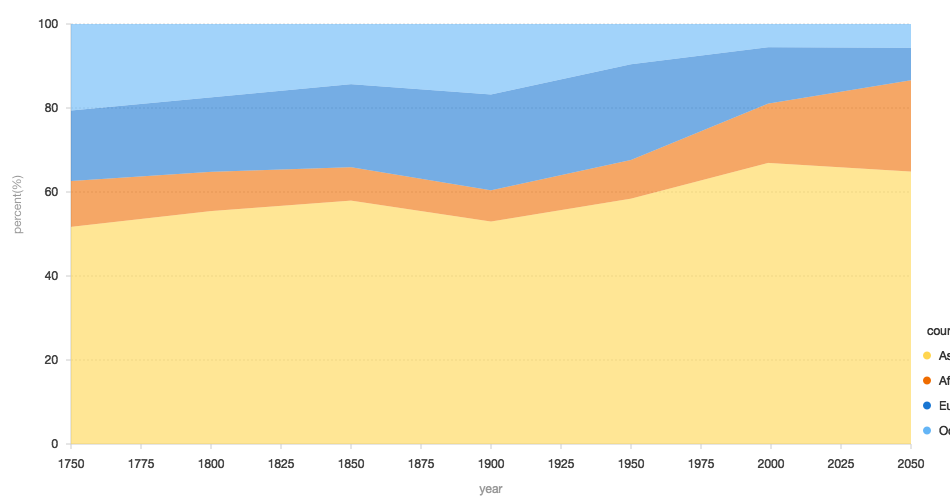
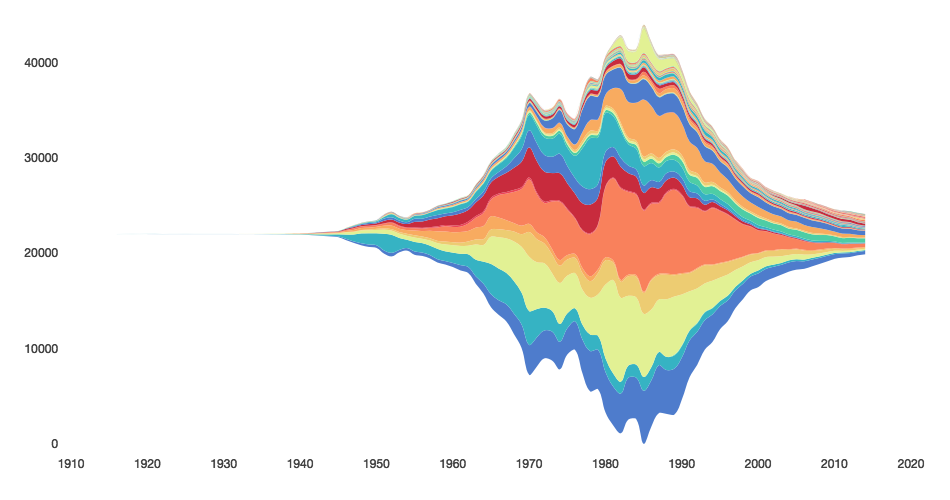
区域图
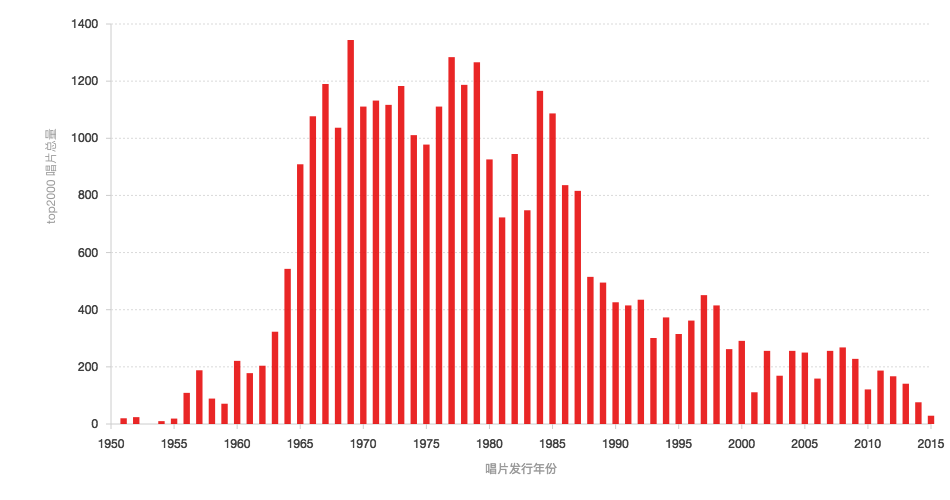
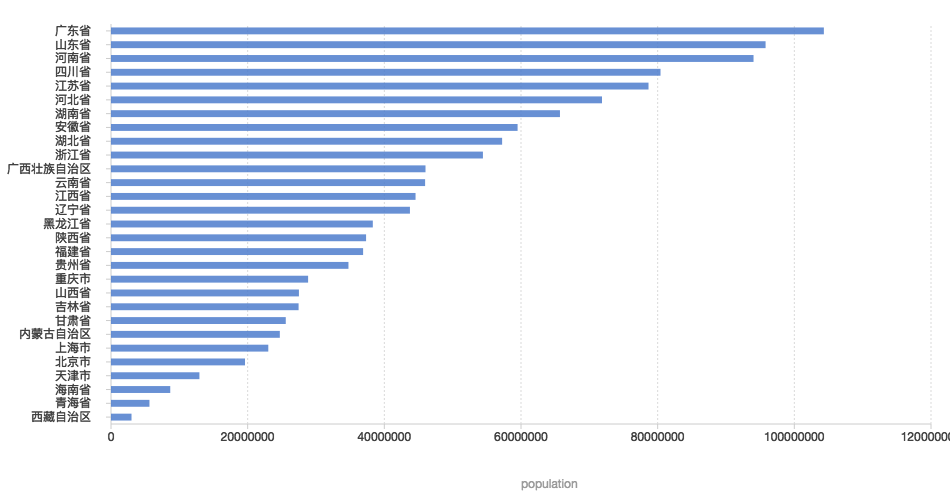
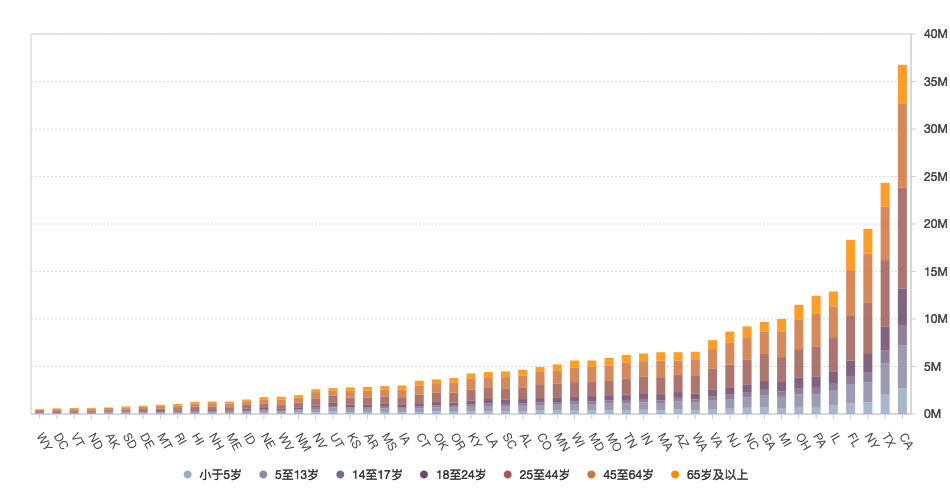
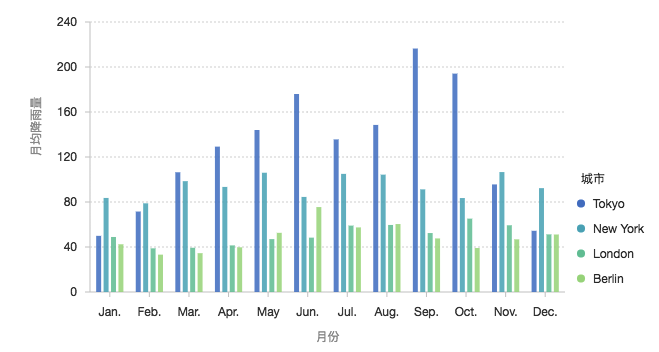
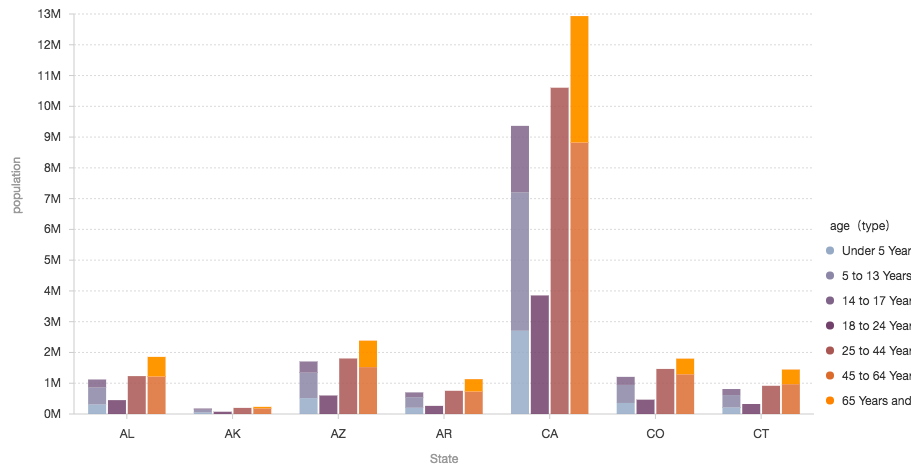
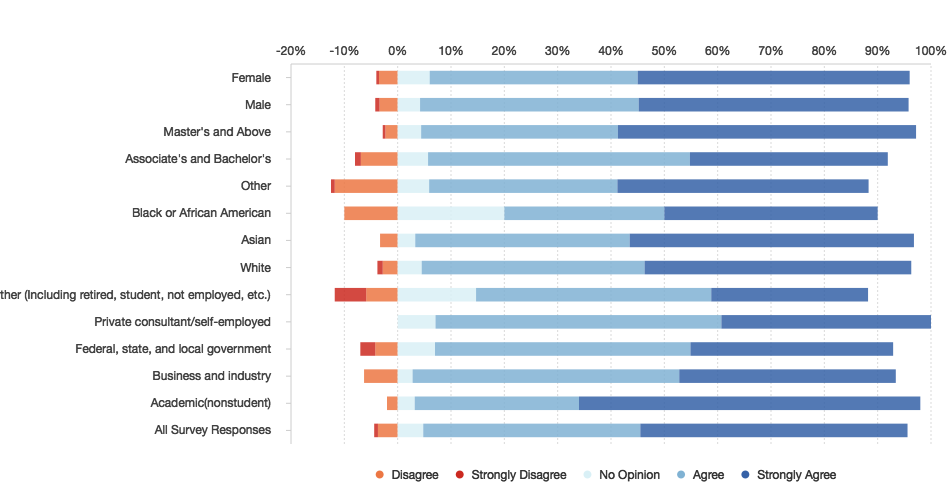
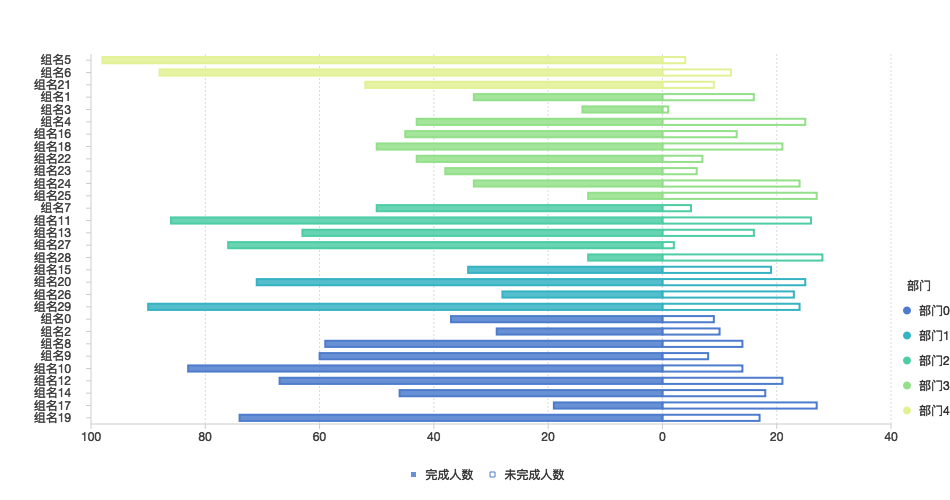
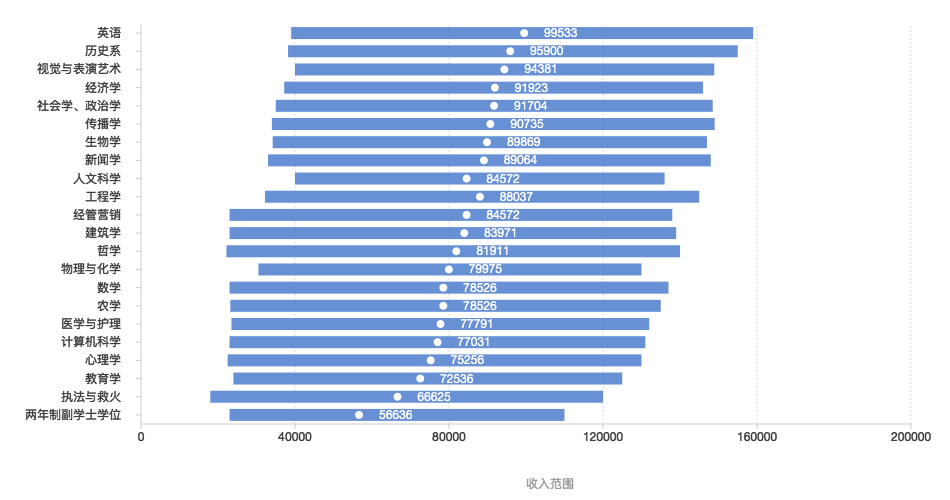
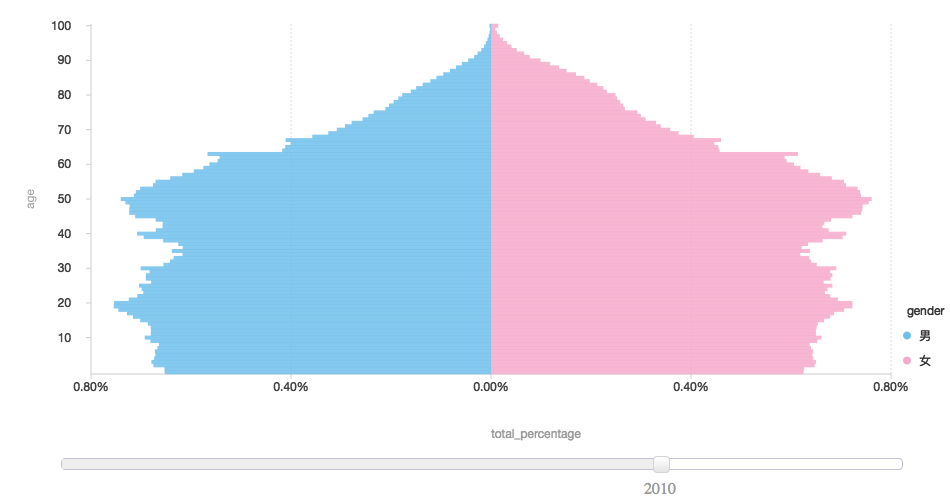
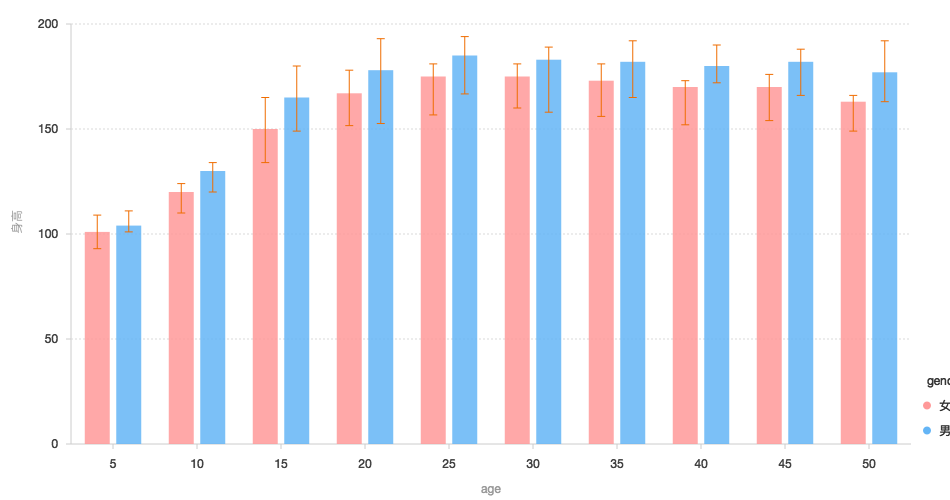
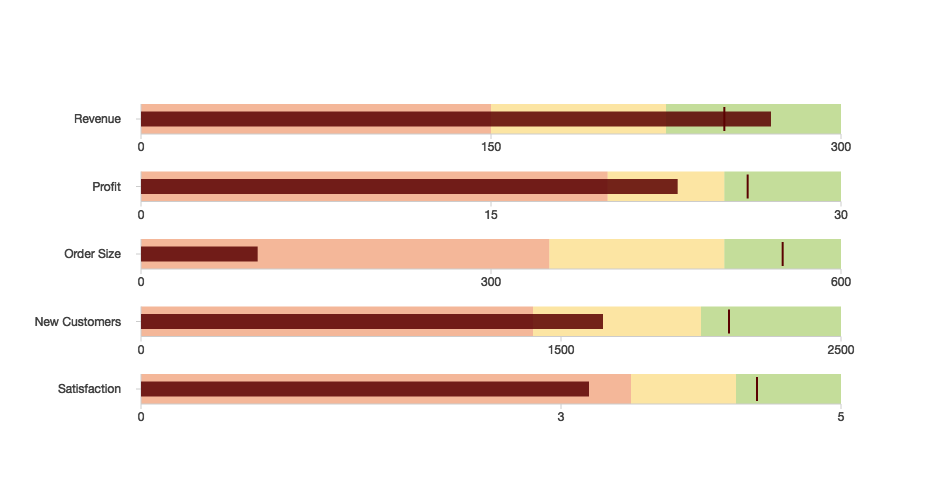
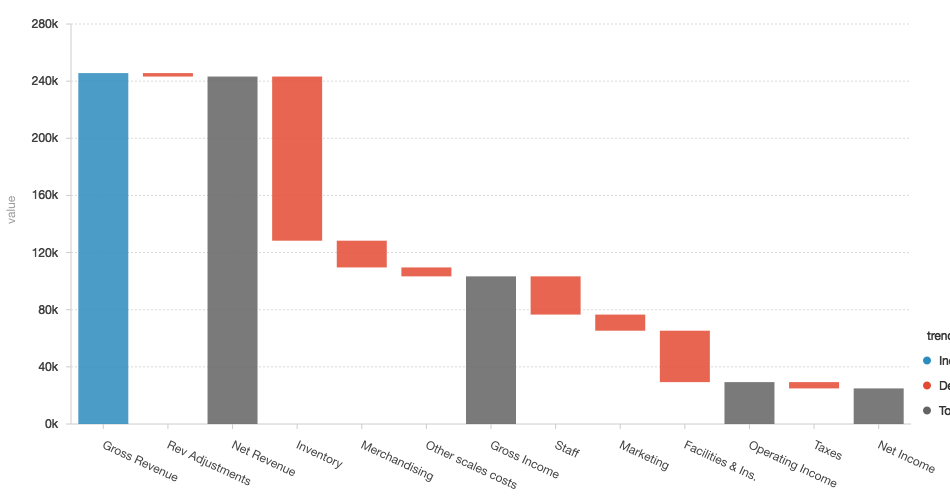
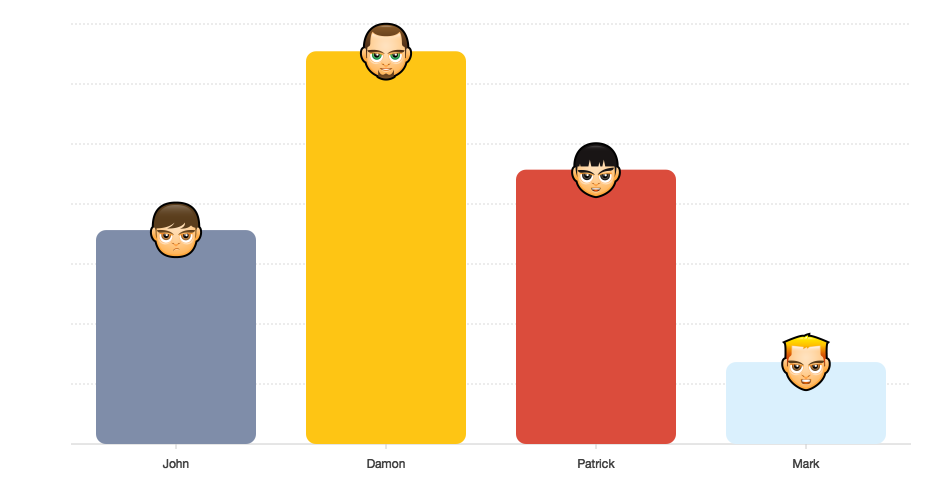
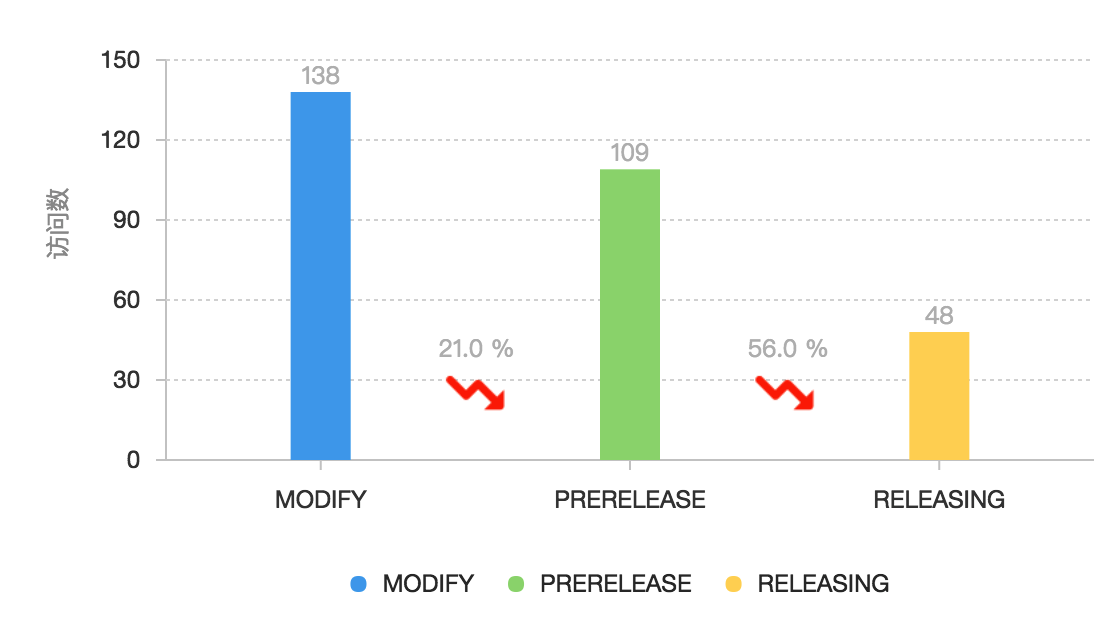
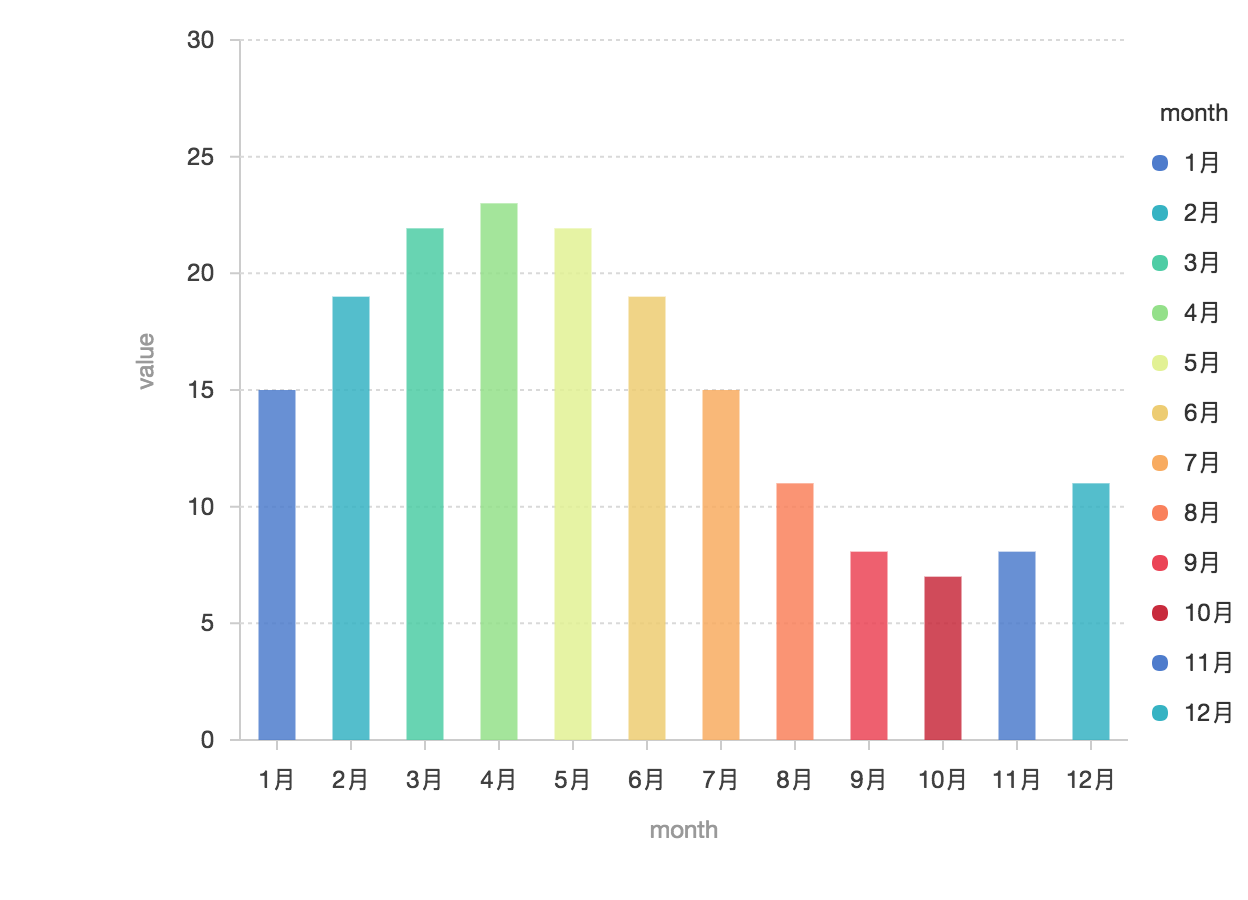
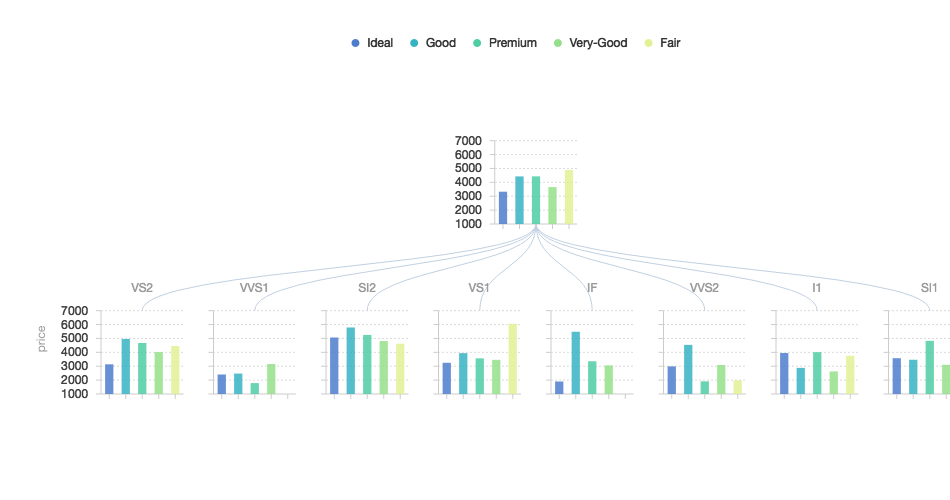
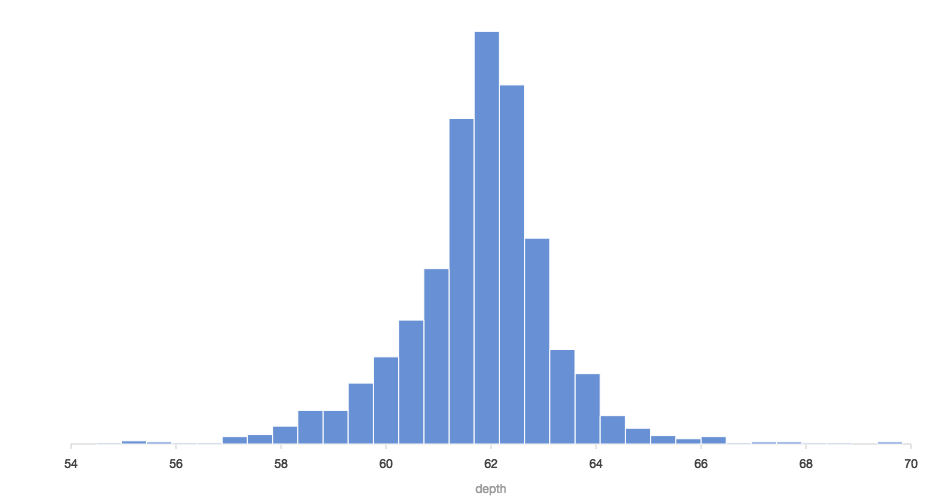
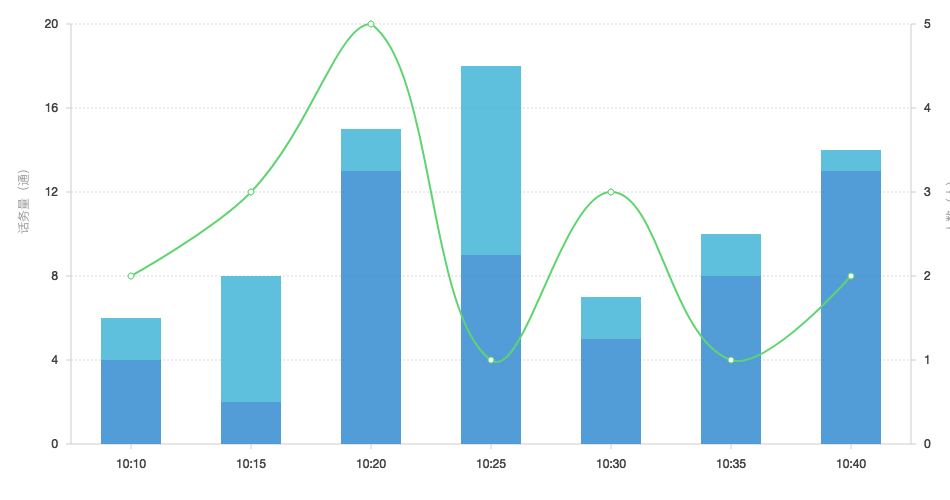
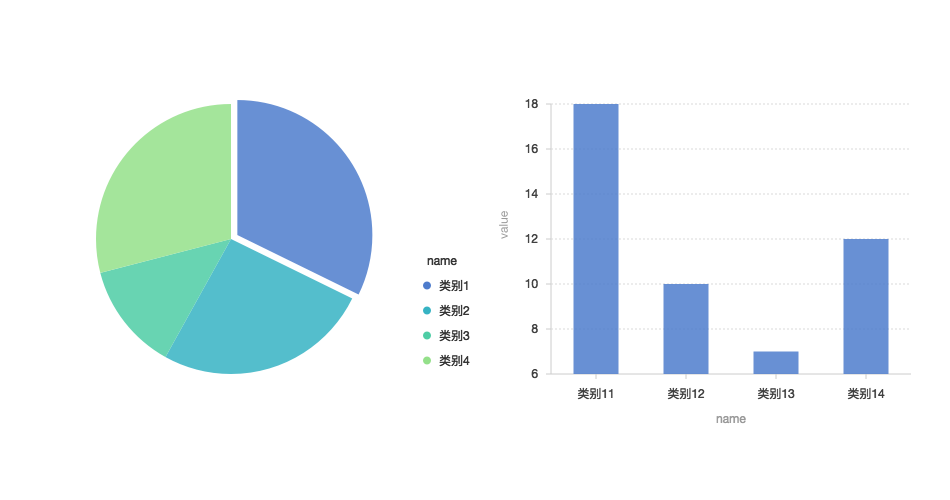
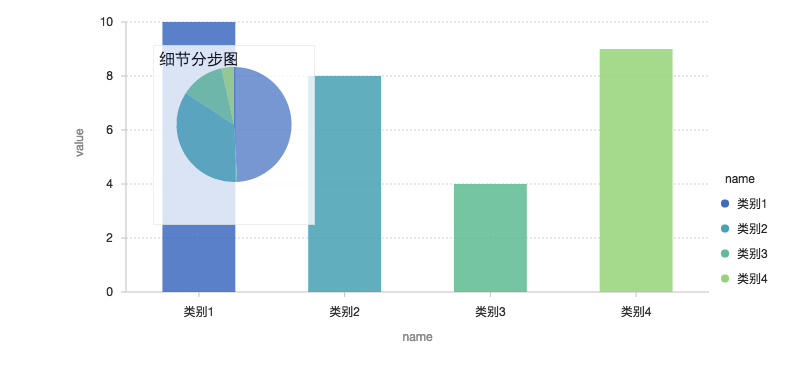
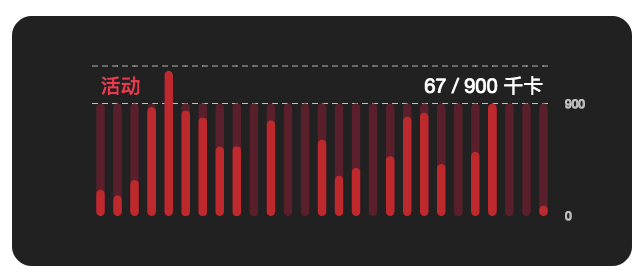
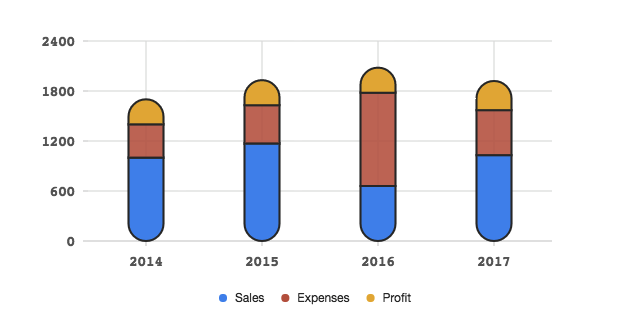
柱状图
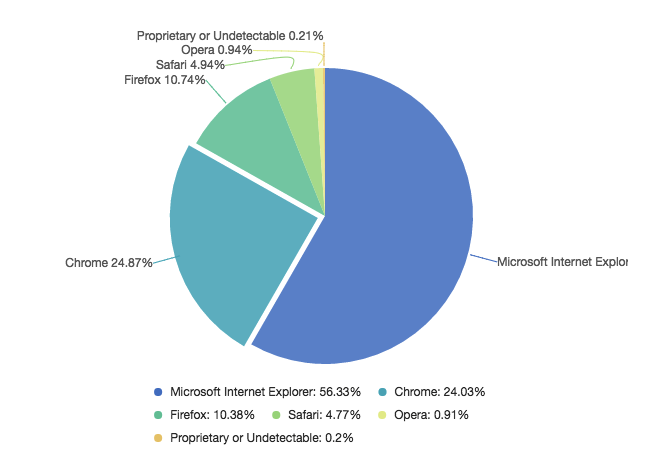
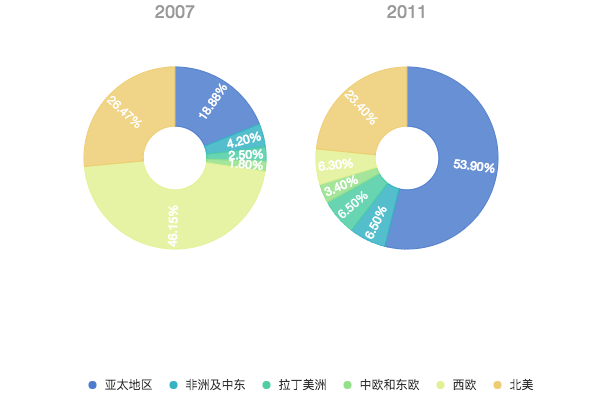
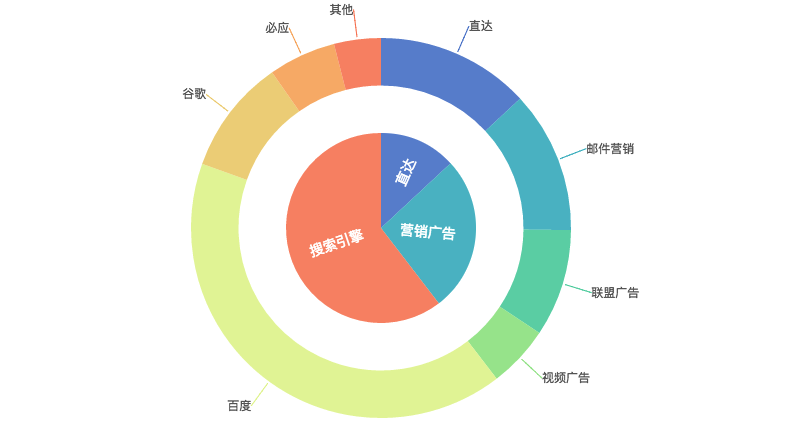
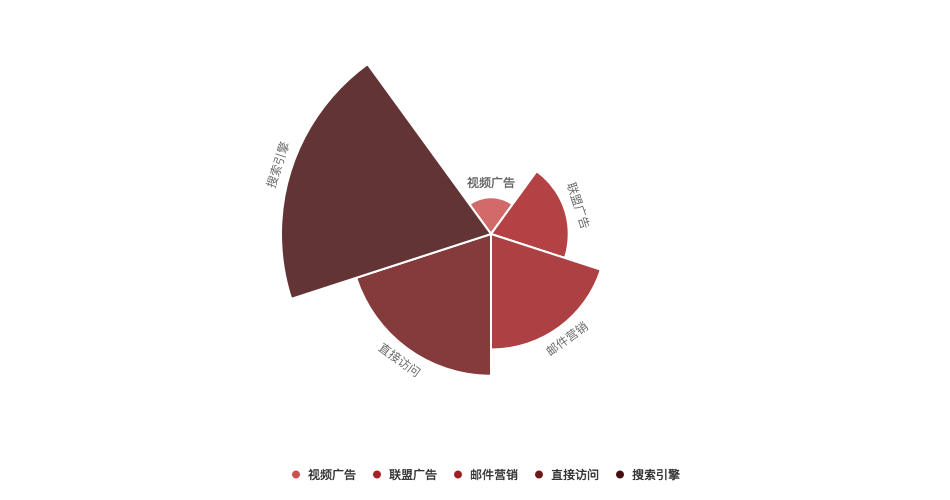
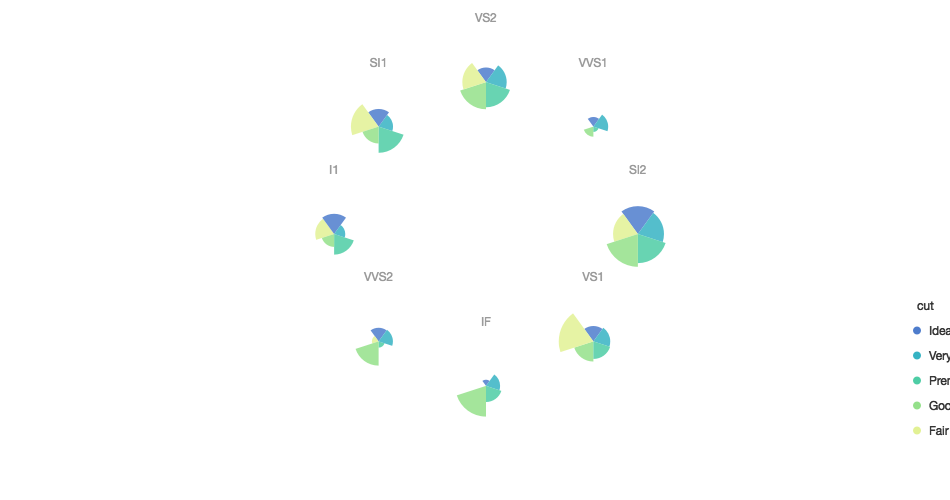
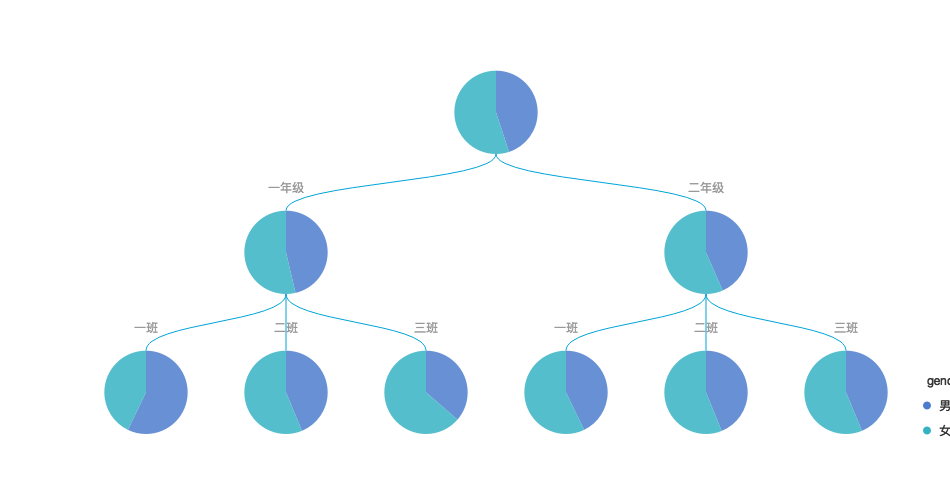
饼图
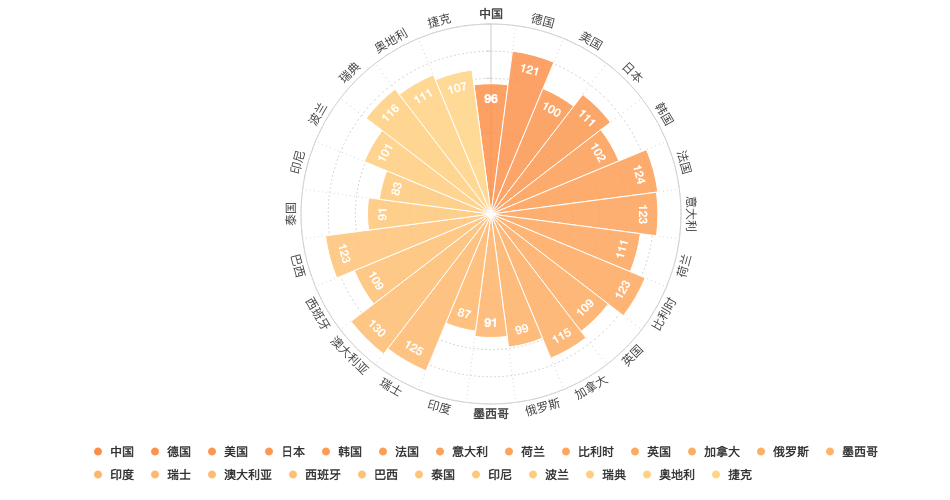
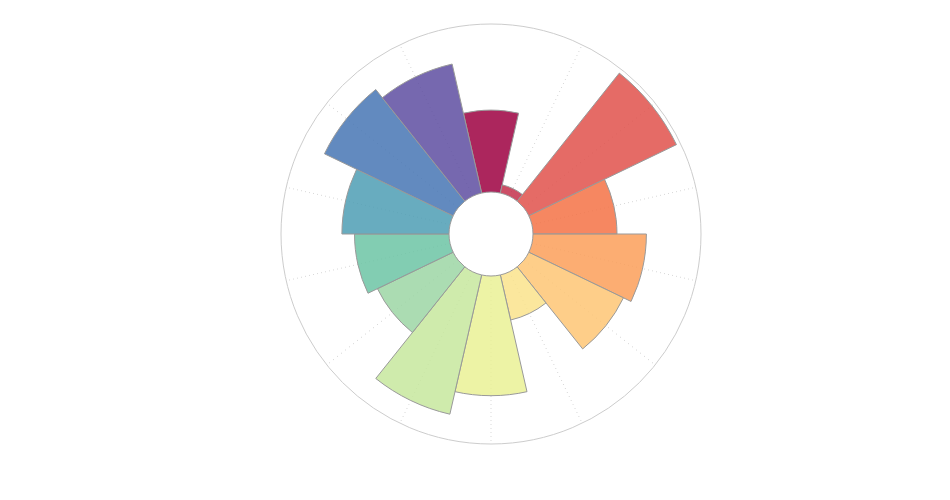
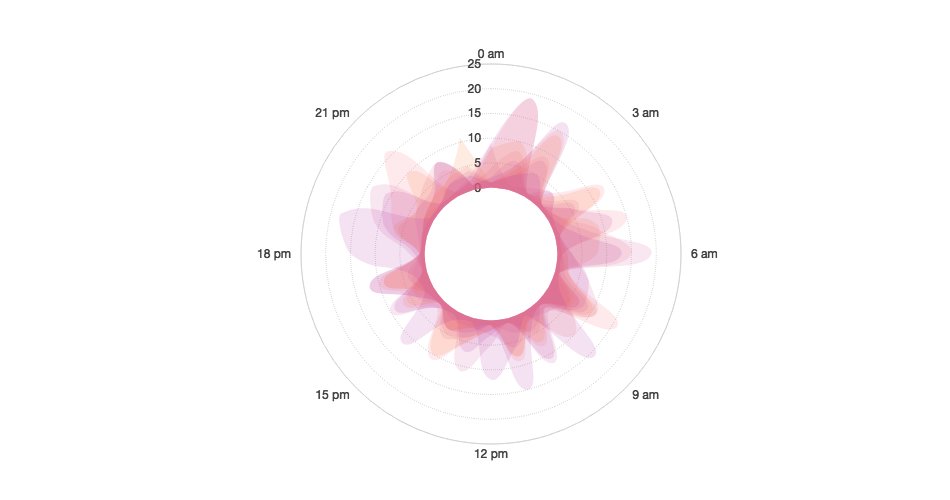
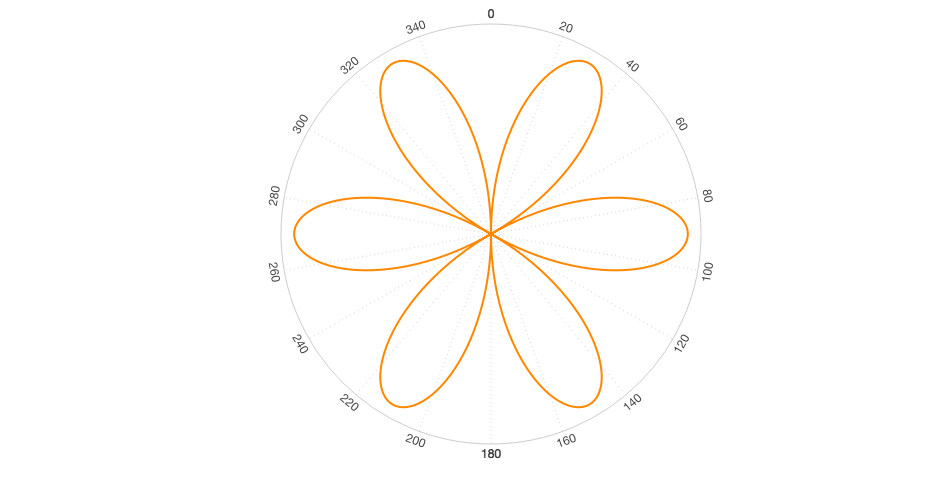
南丁格尔玫瑰图
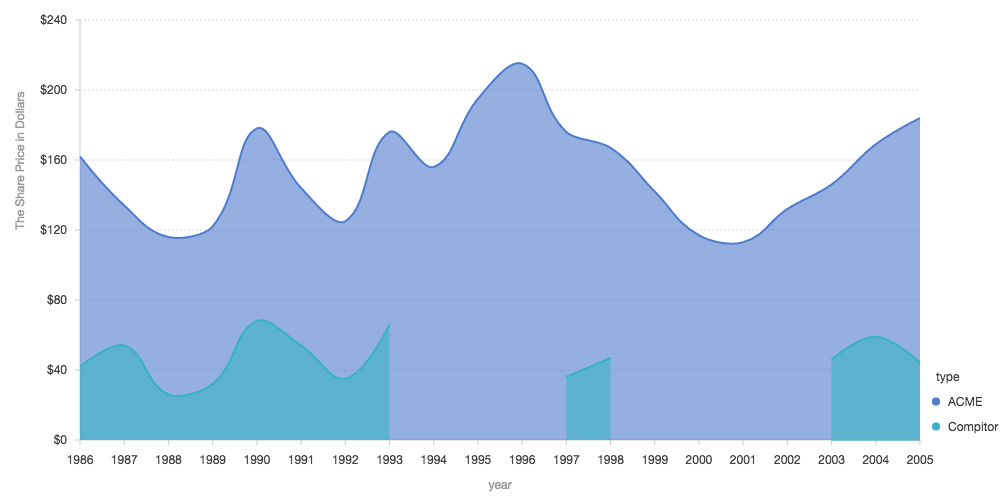
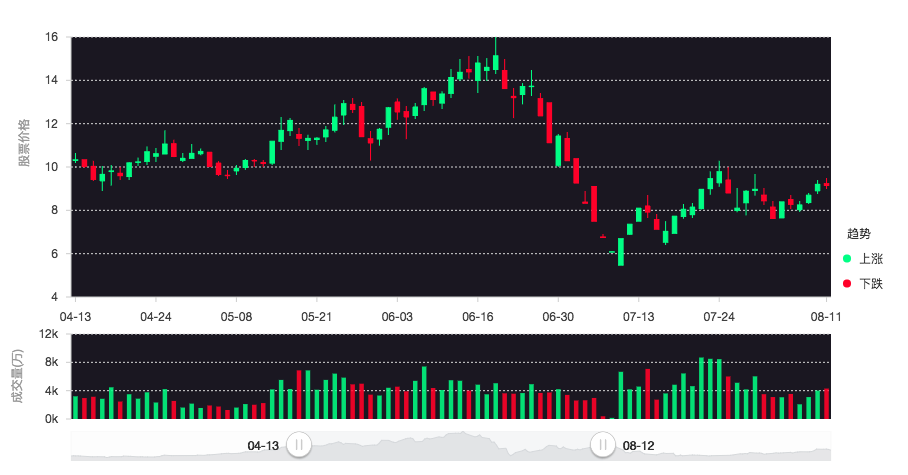
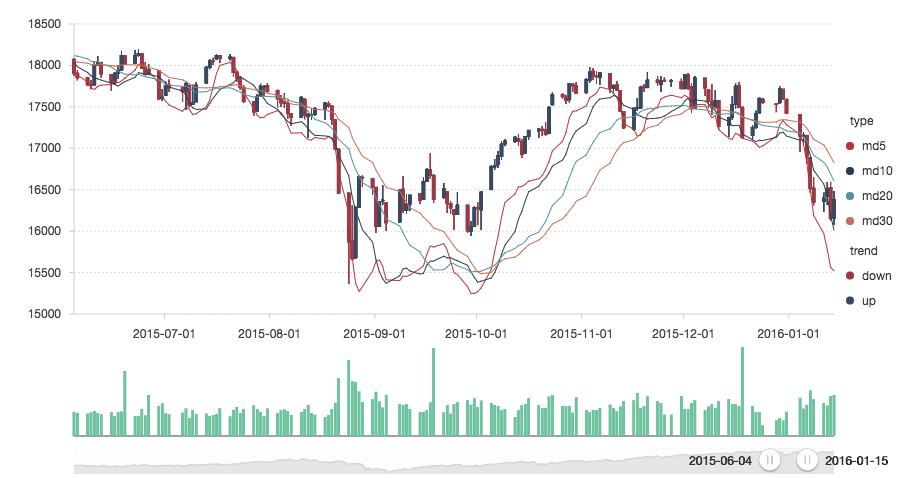
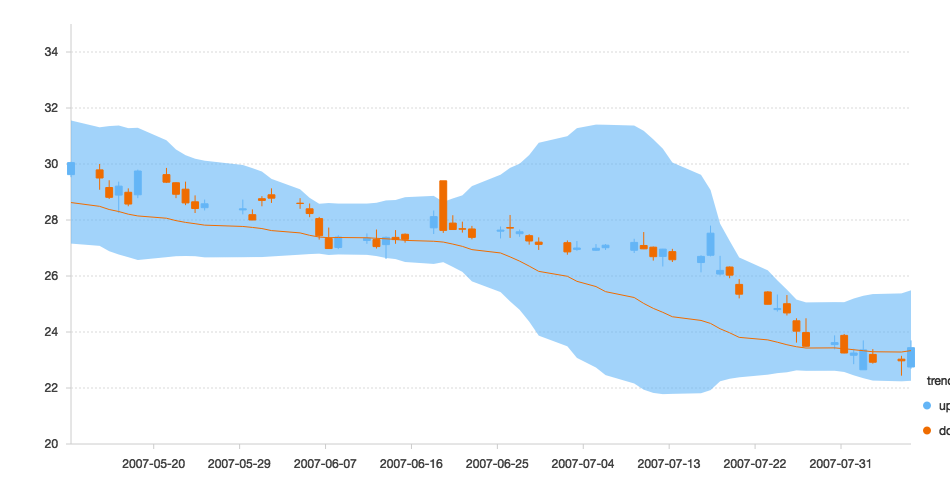
股票图
漏斗图
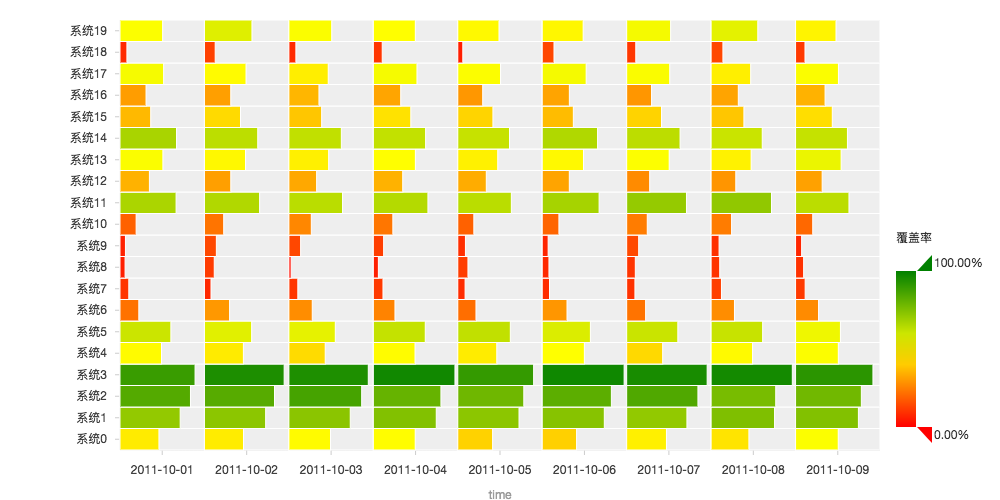
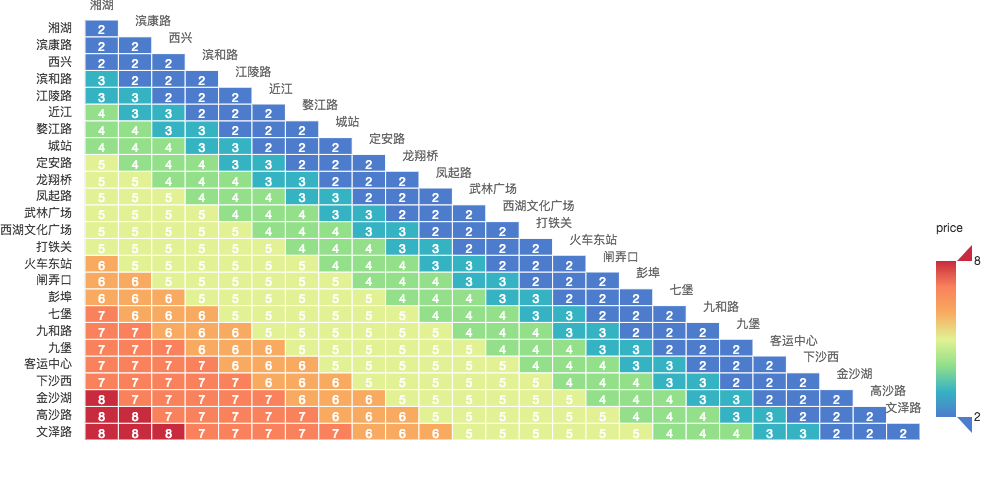
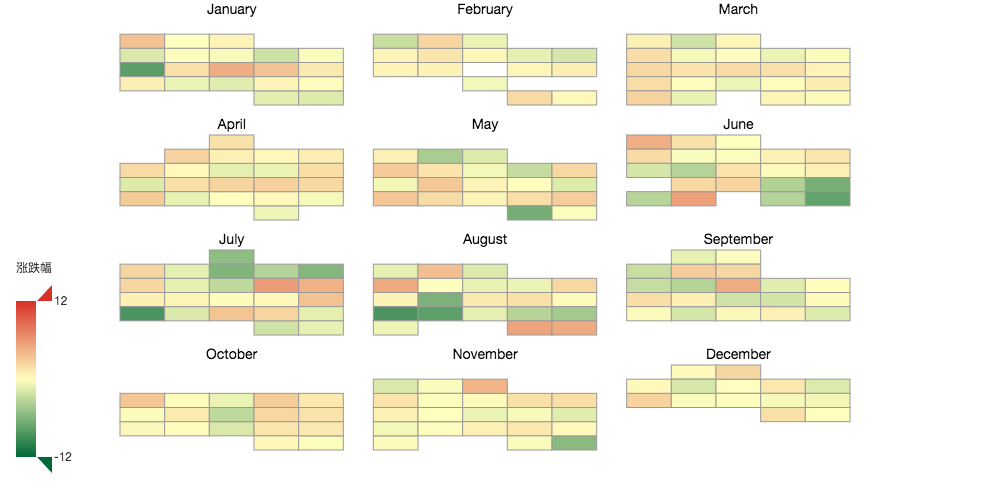
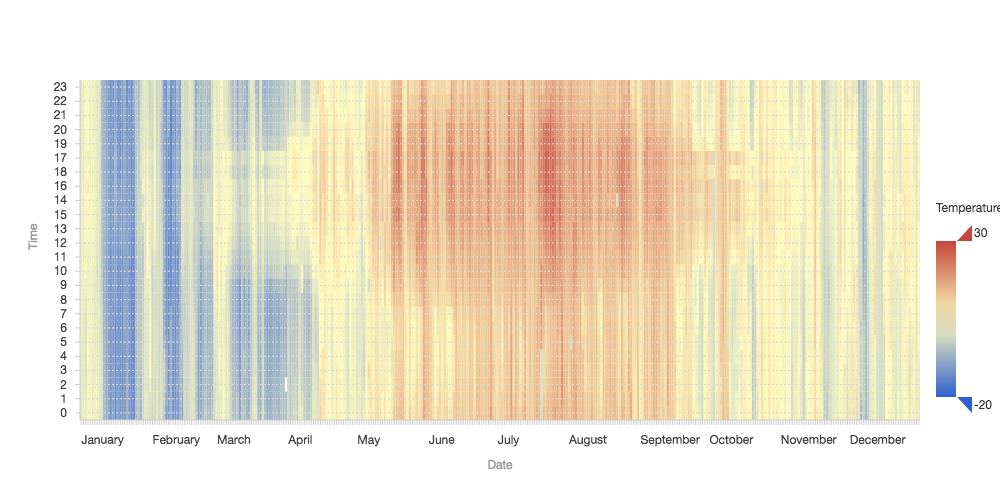
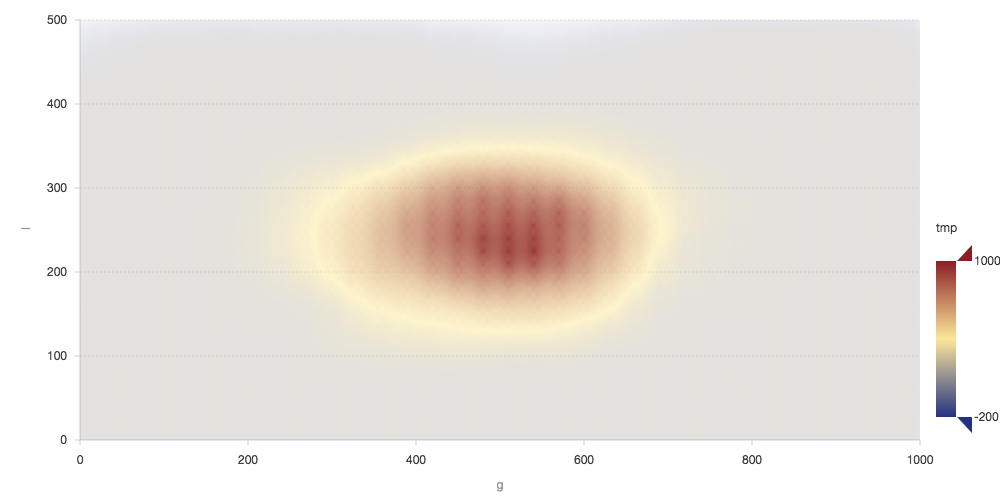
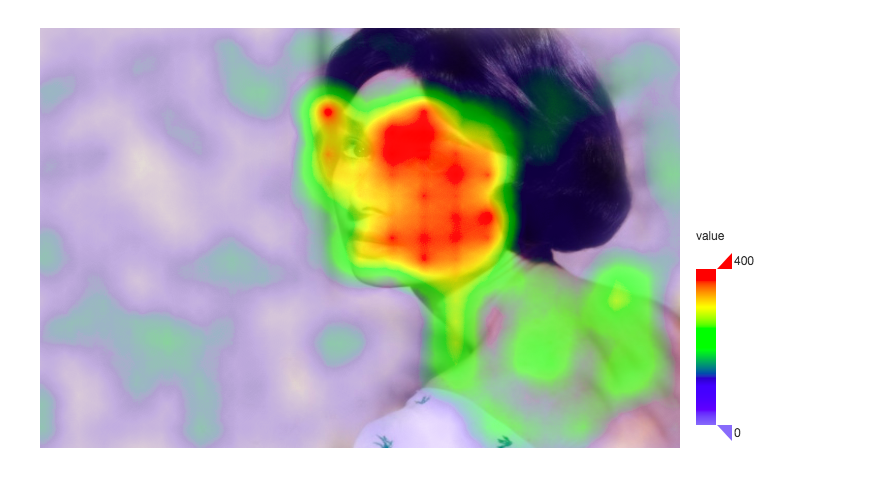
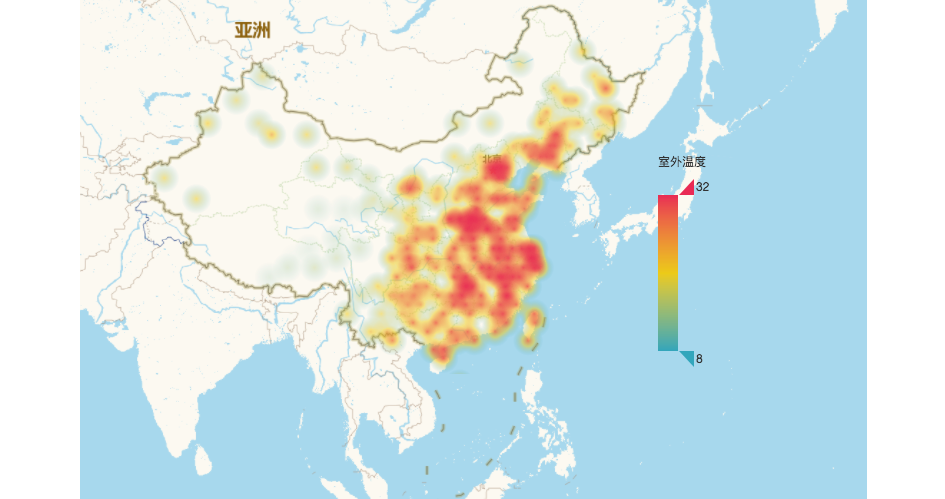
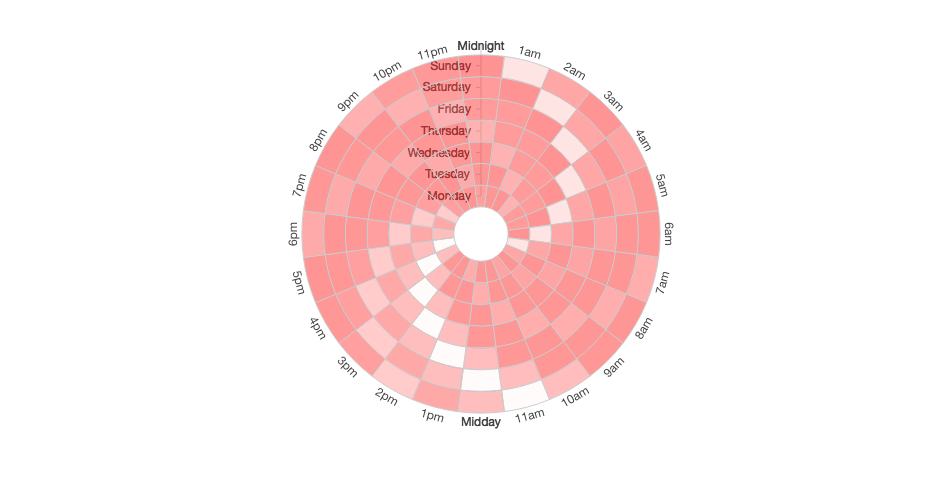
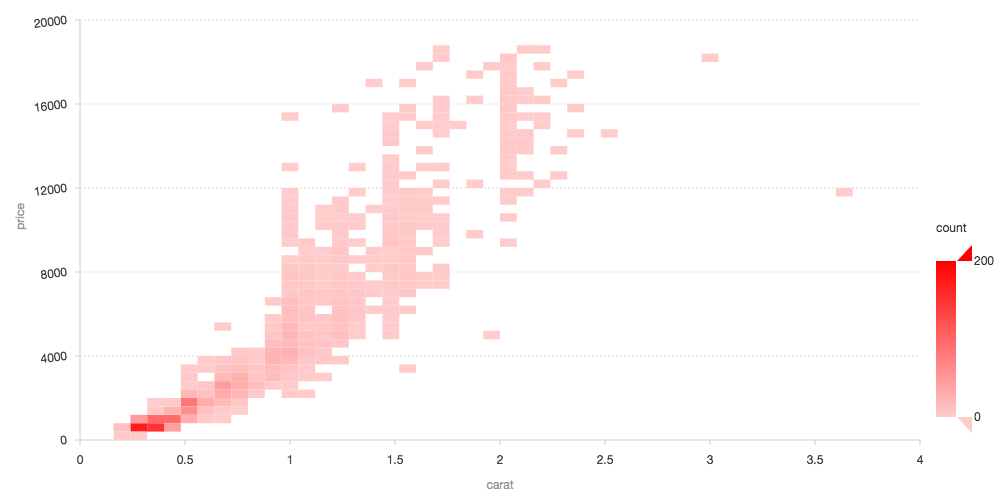
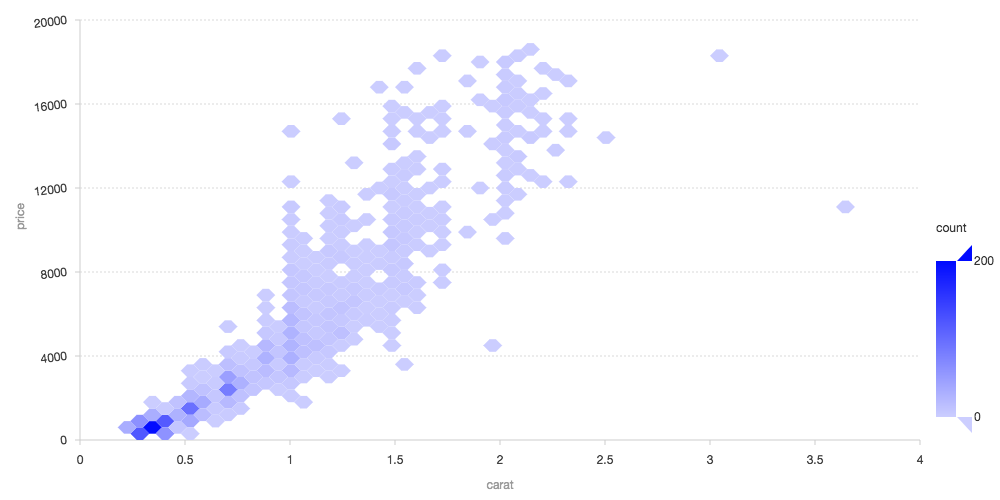
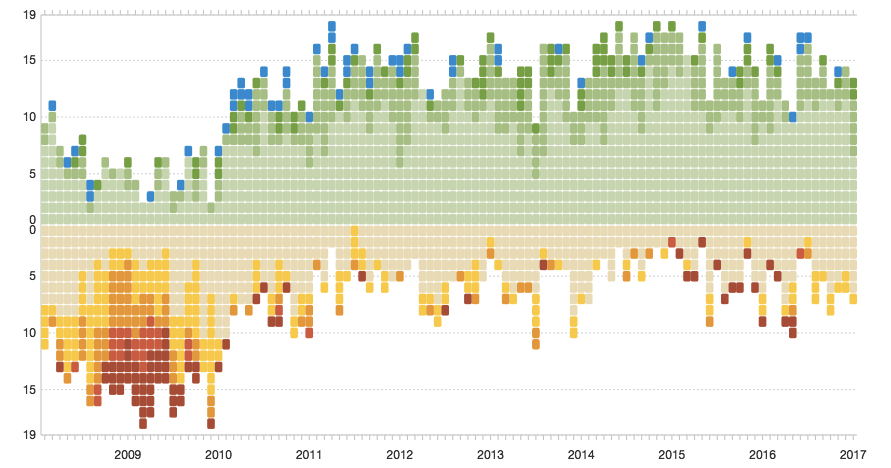
热力或色块图
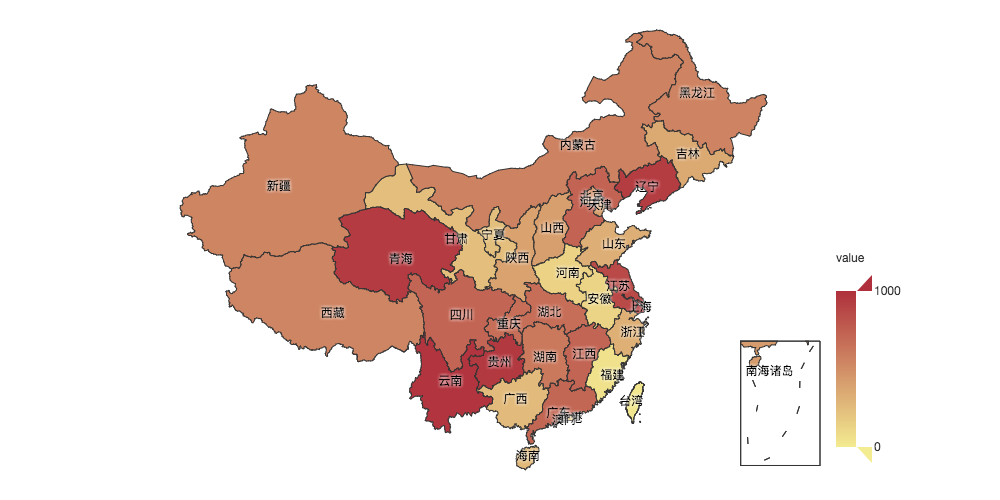
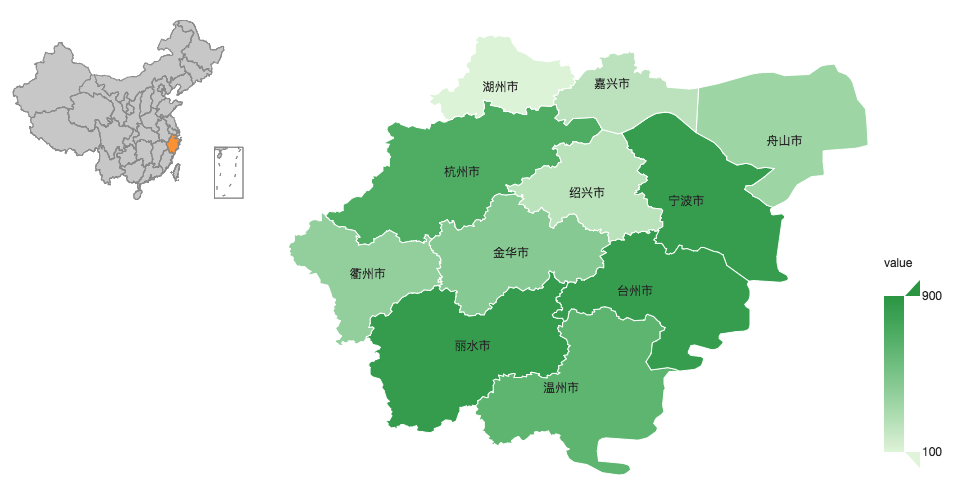
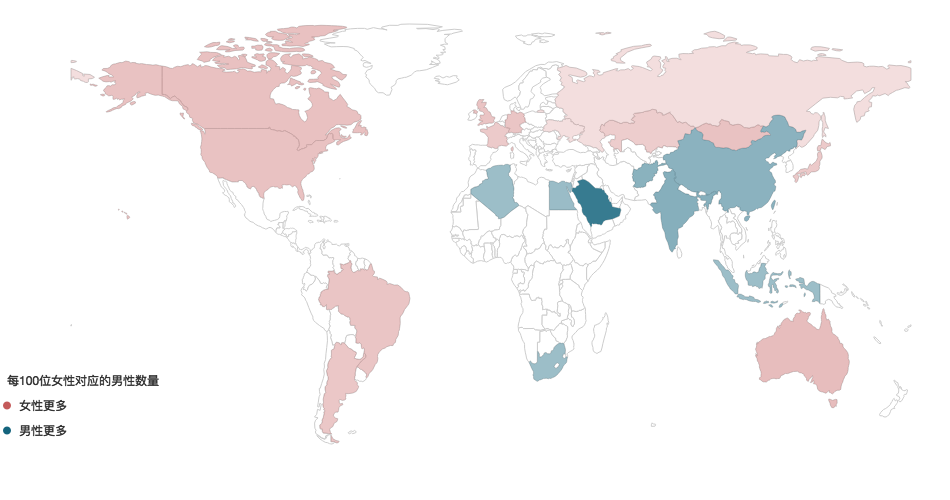
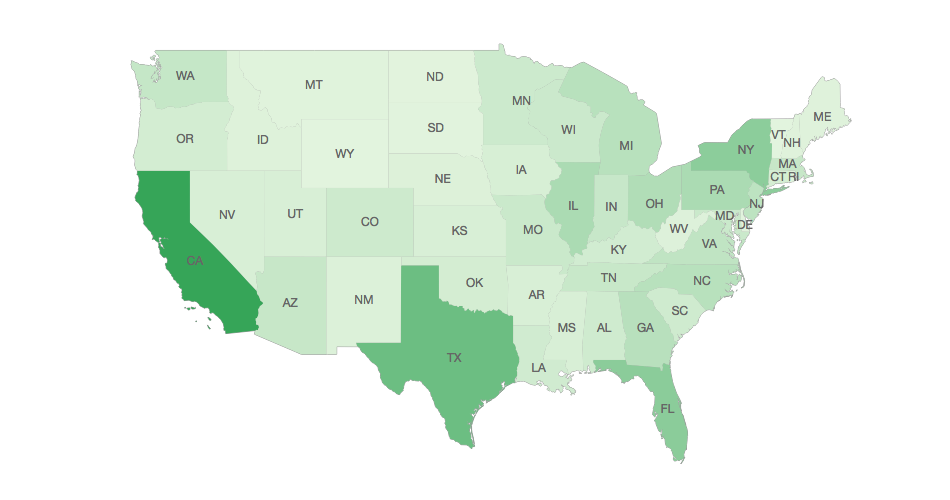
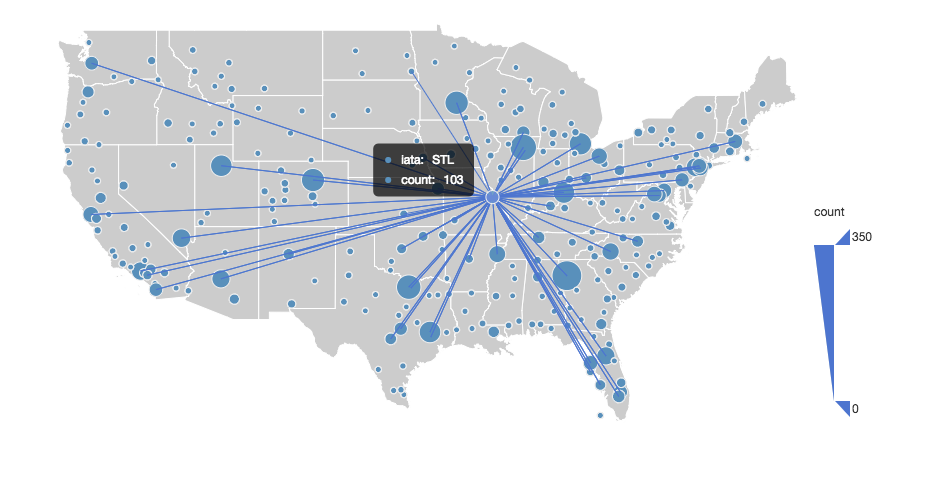
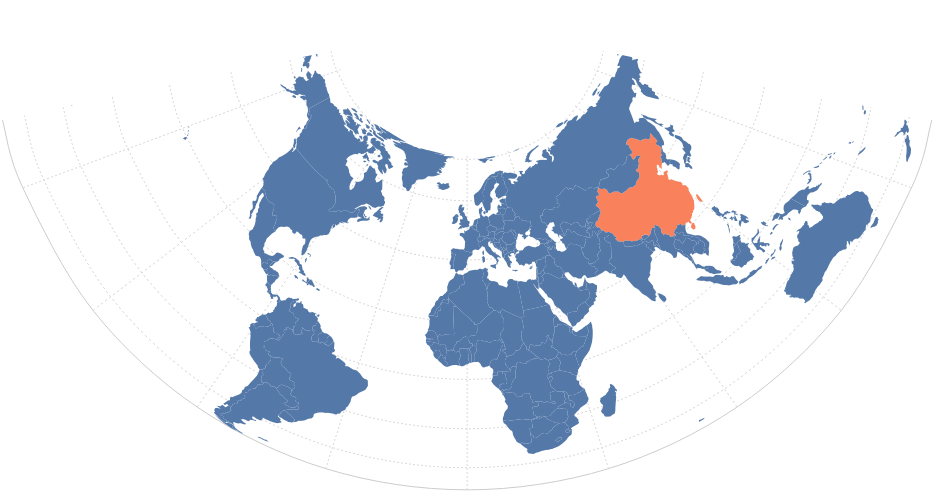
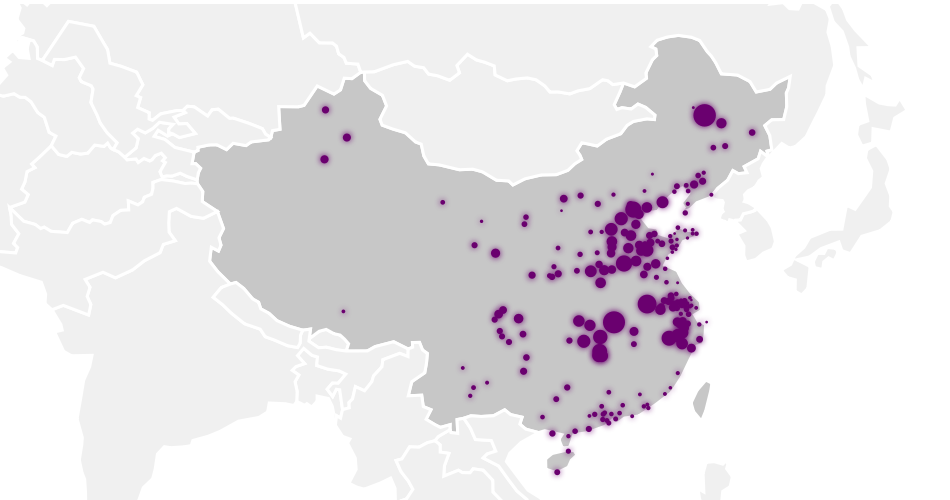
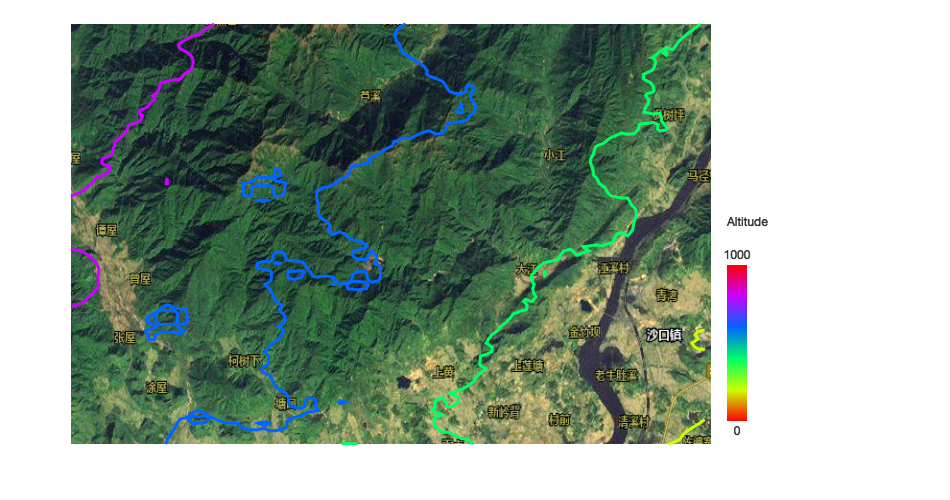
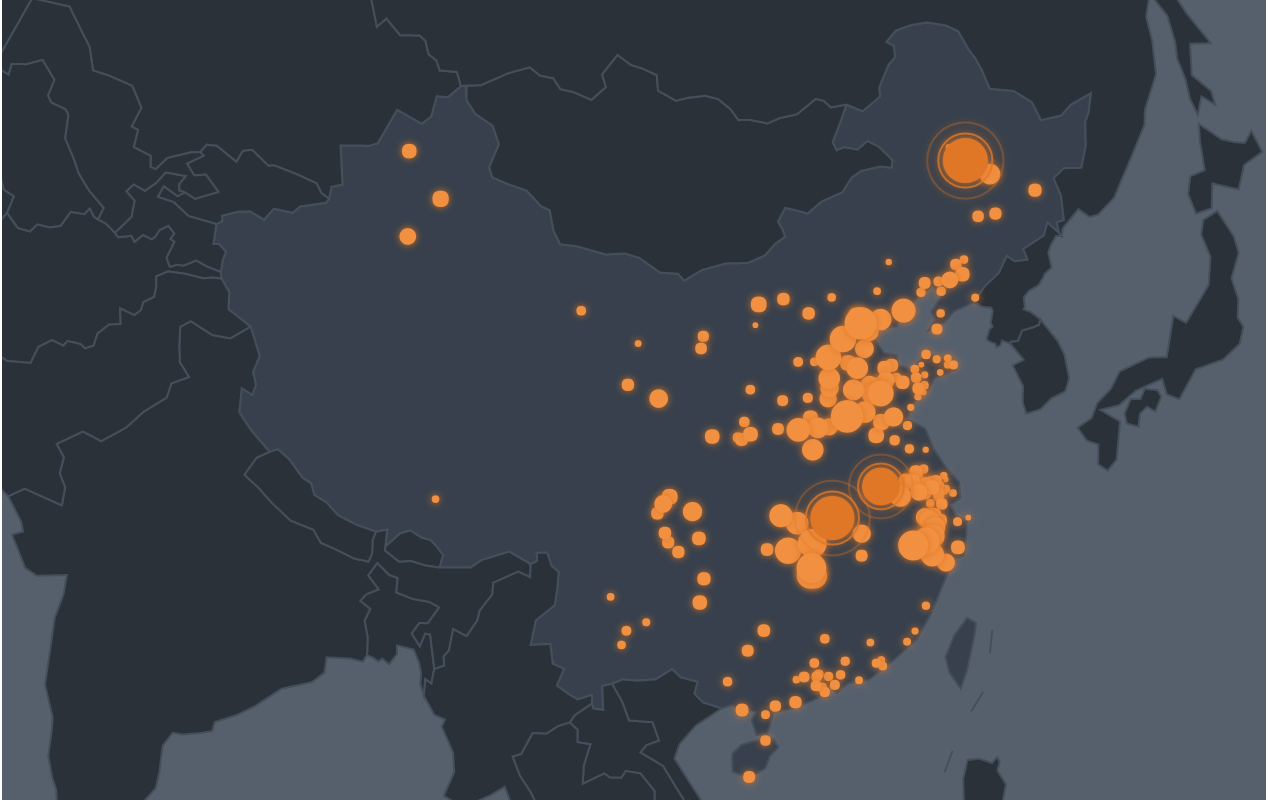
地图
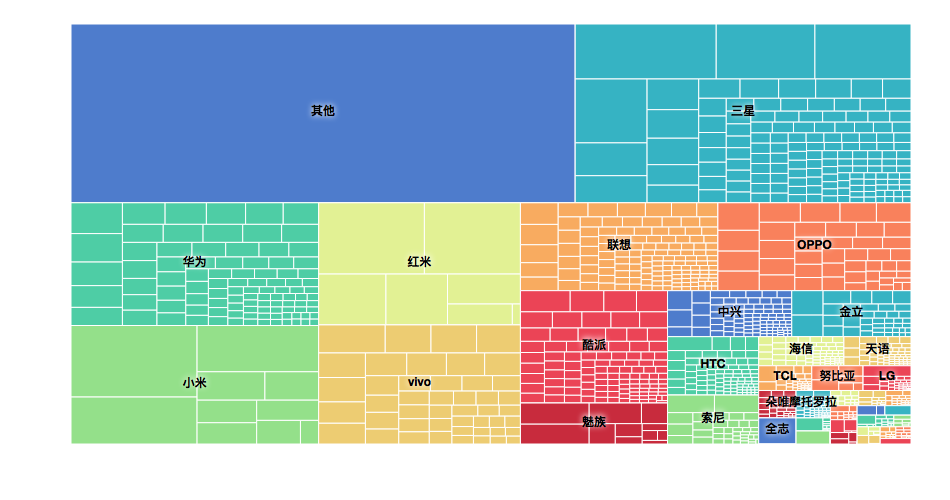
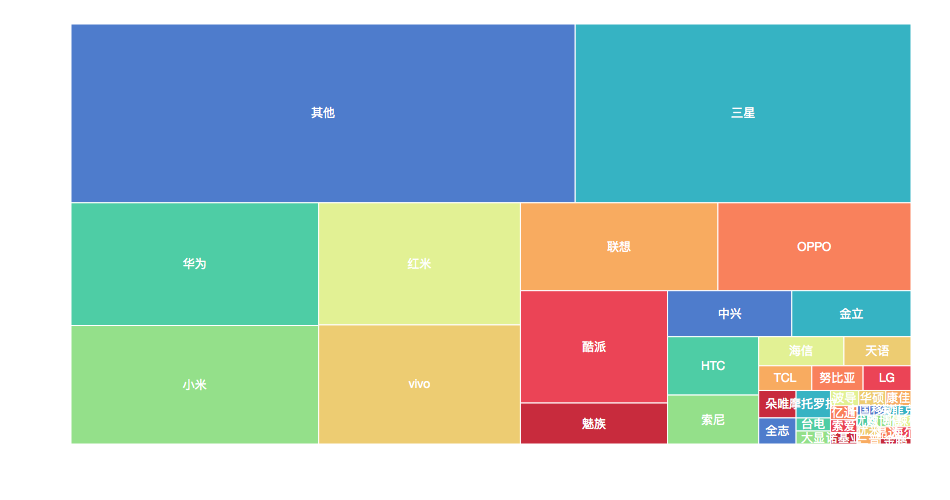
treemap
仪表盘
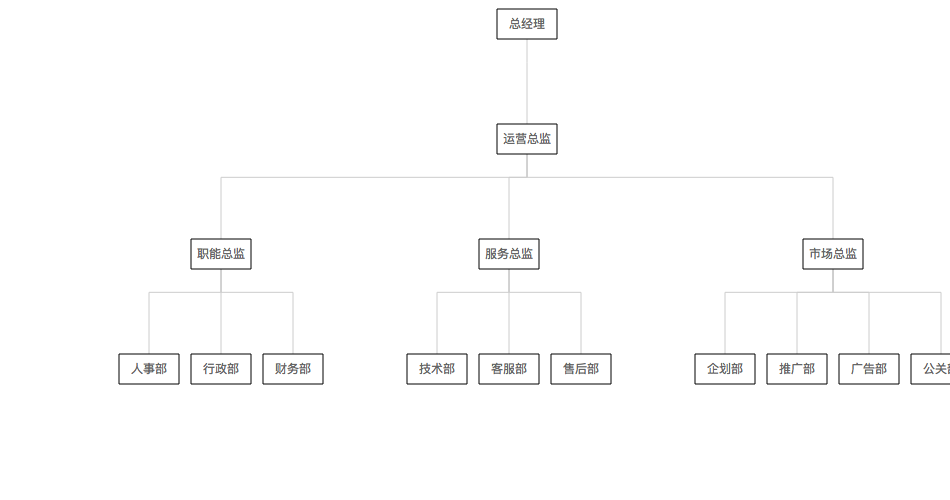
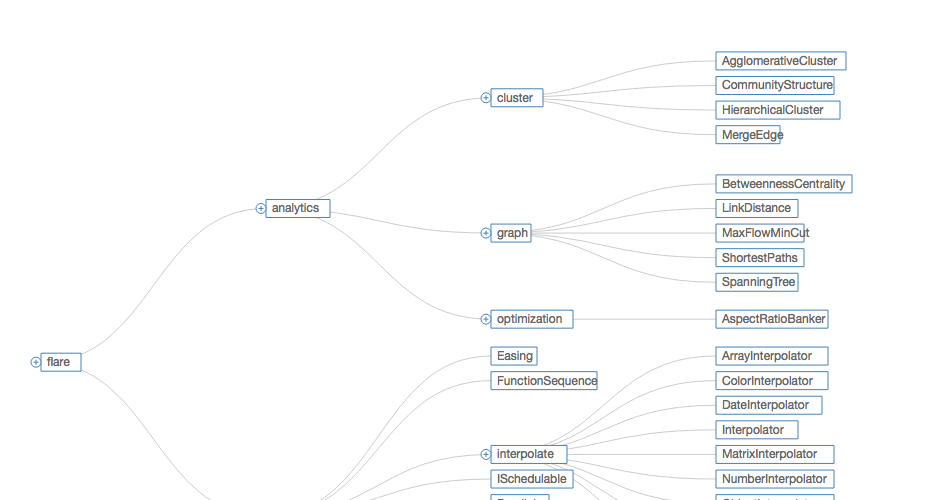
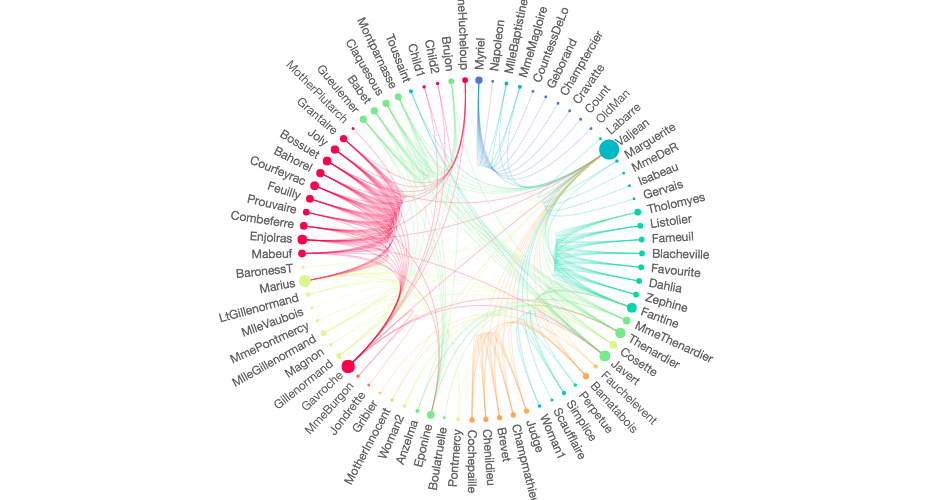
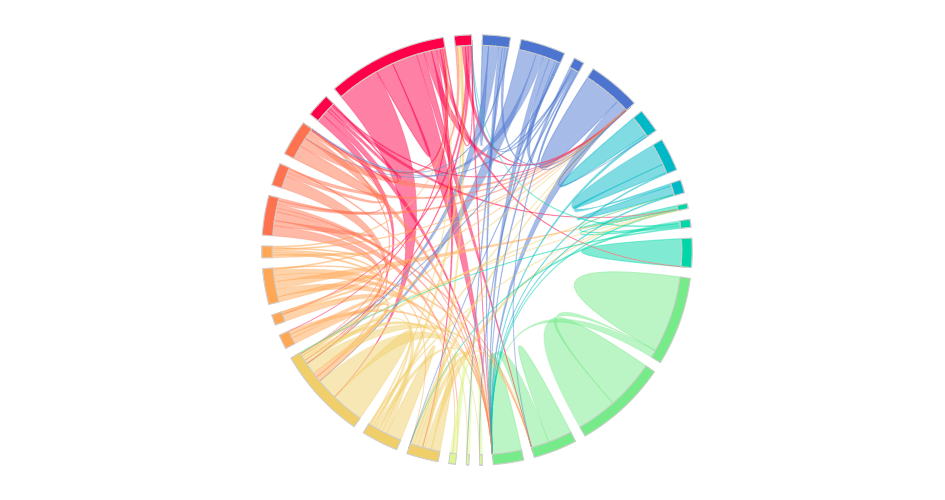
关系图
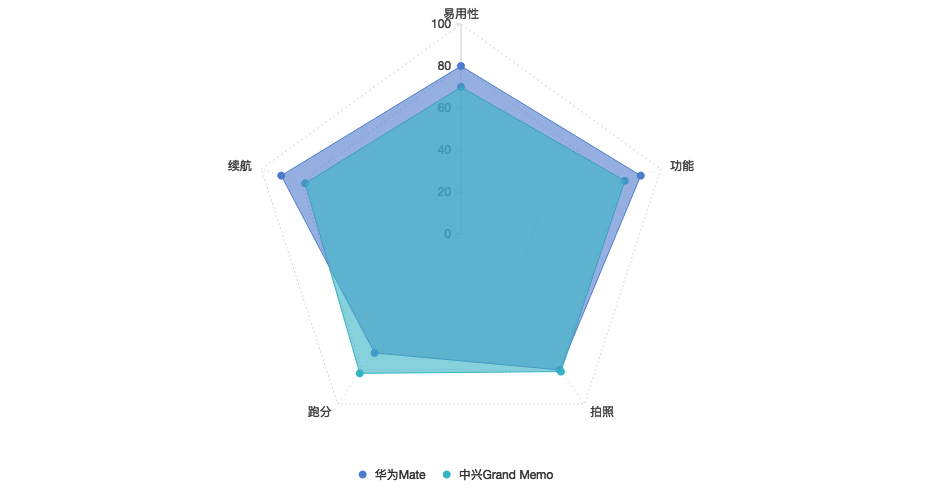
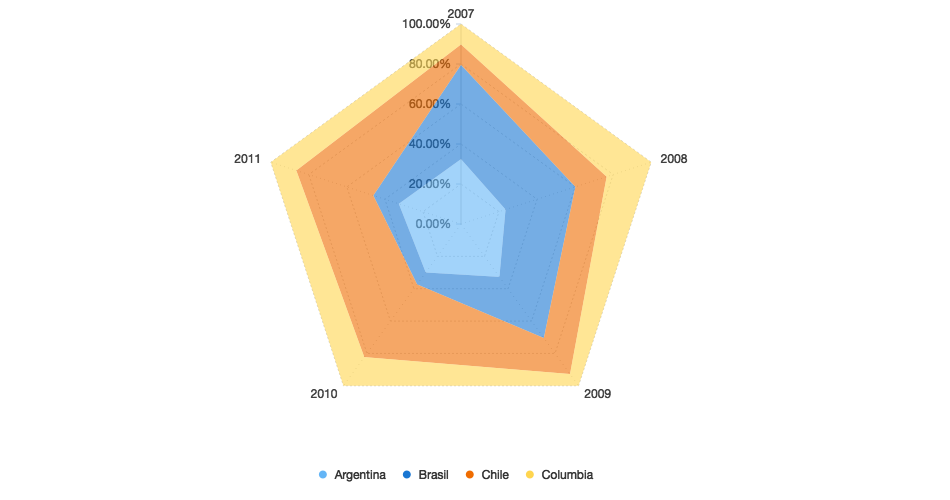
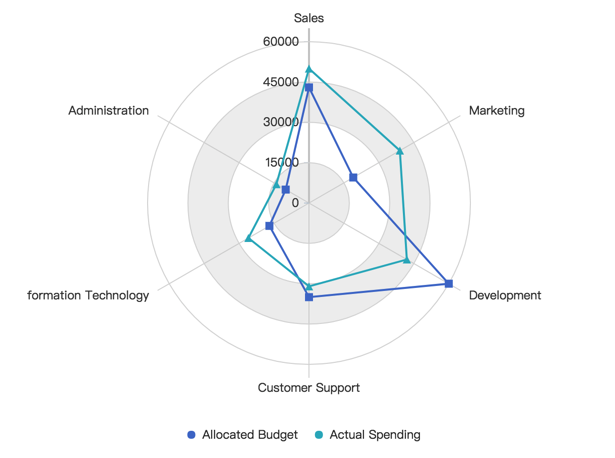
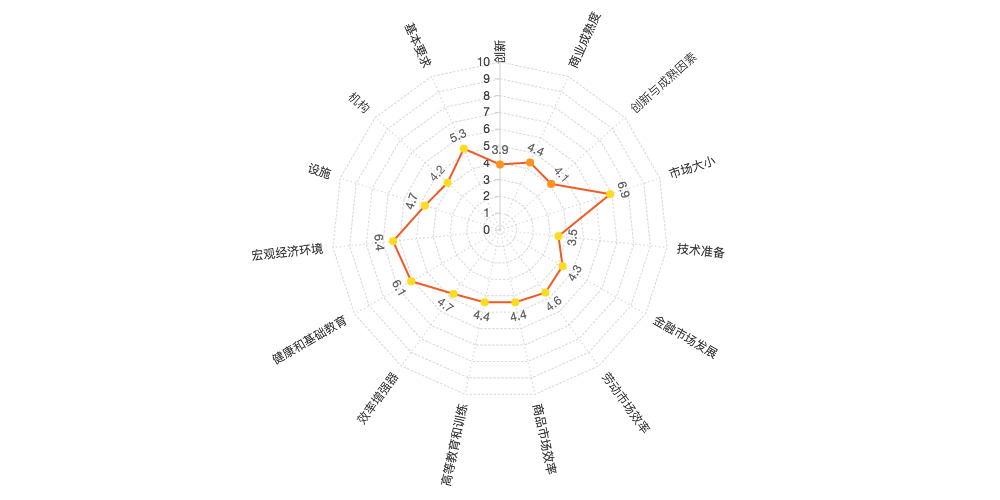
雷达图
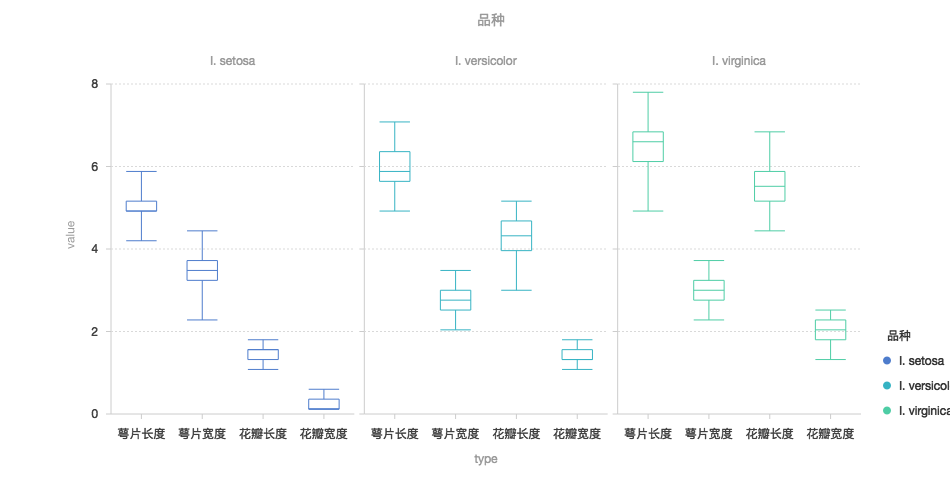
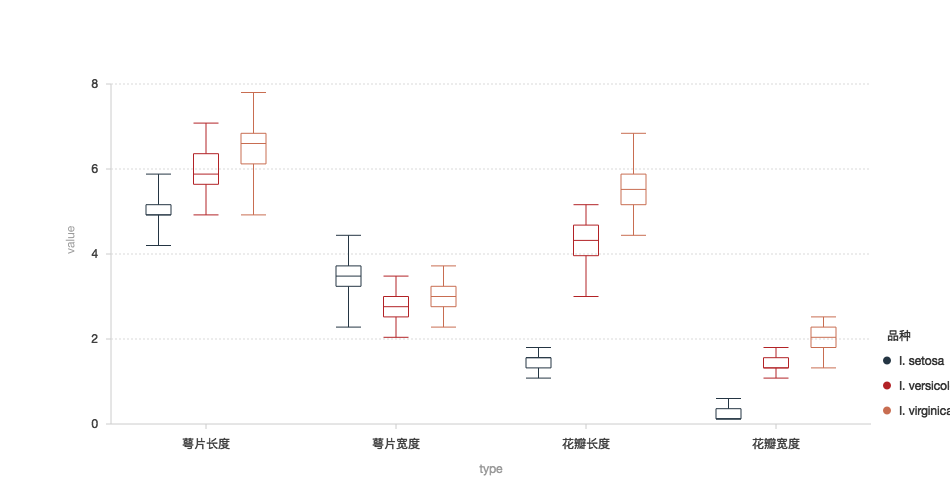
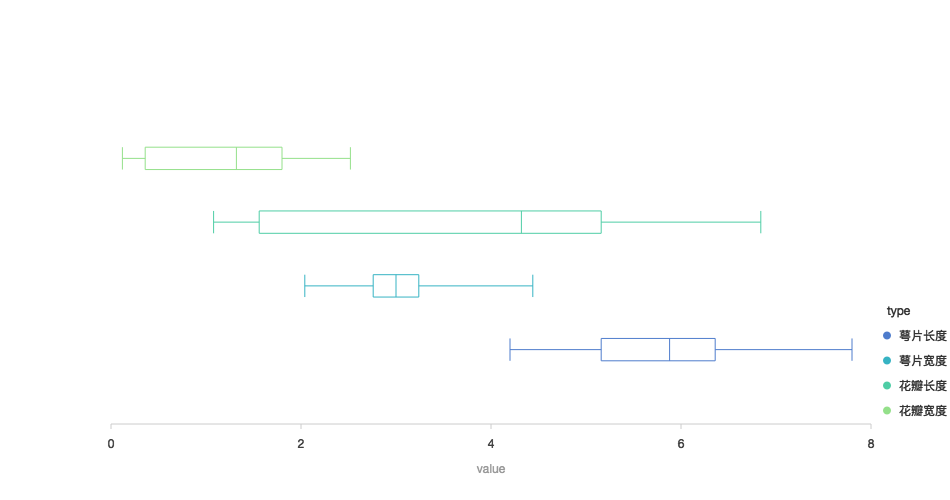
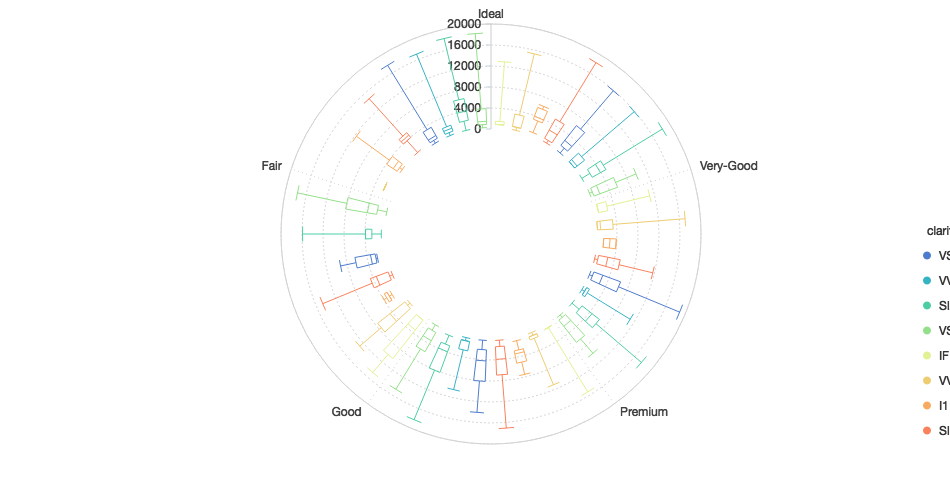
箱型图
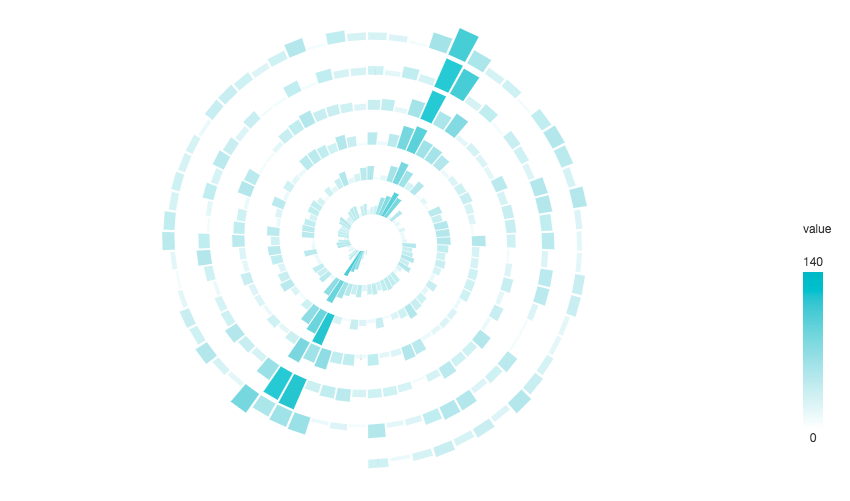
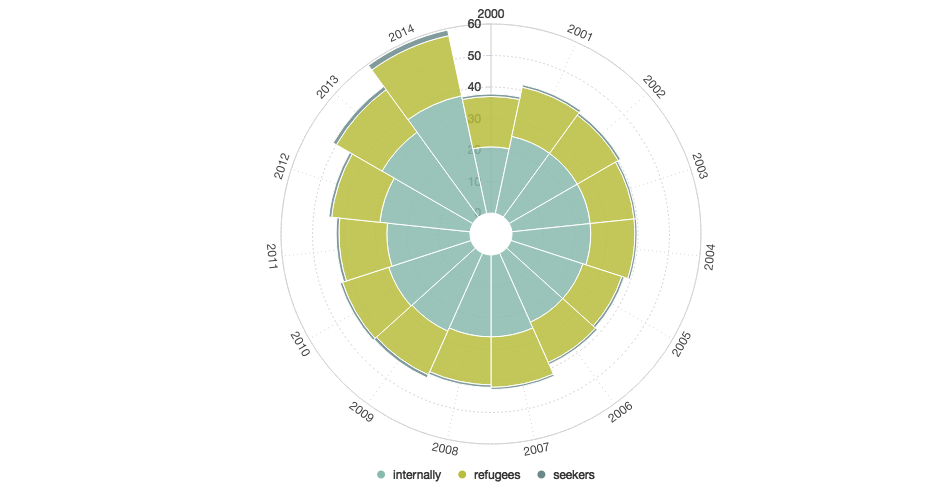
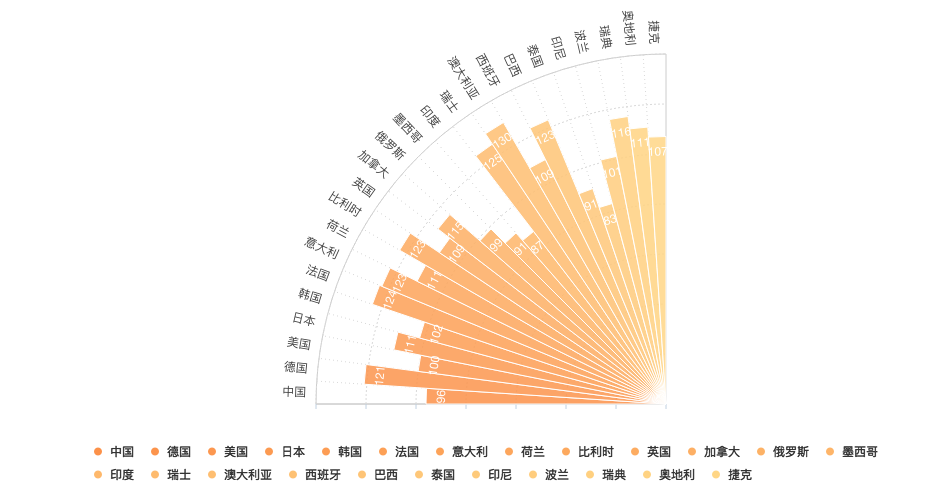
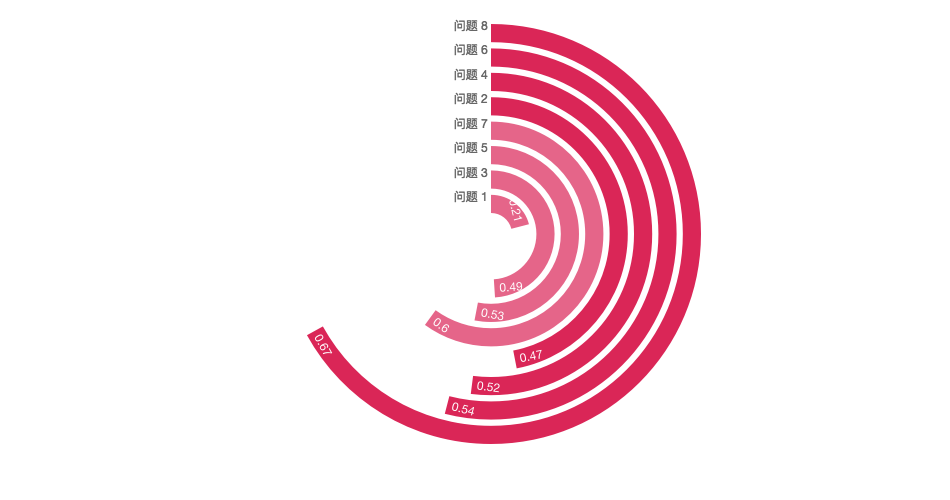
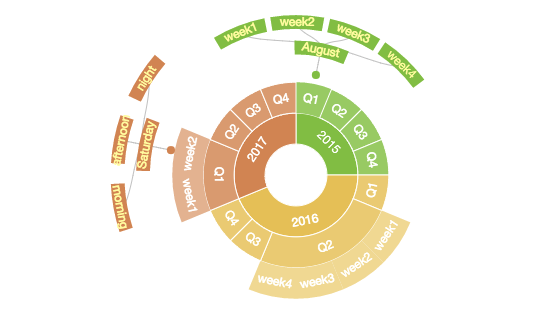
极坐标
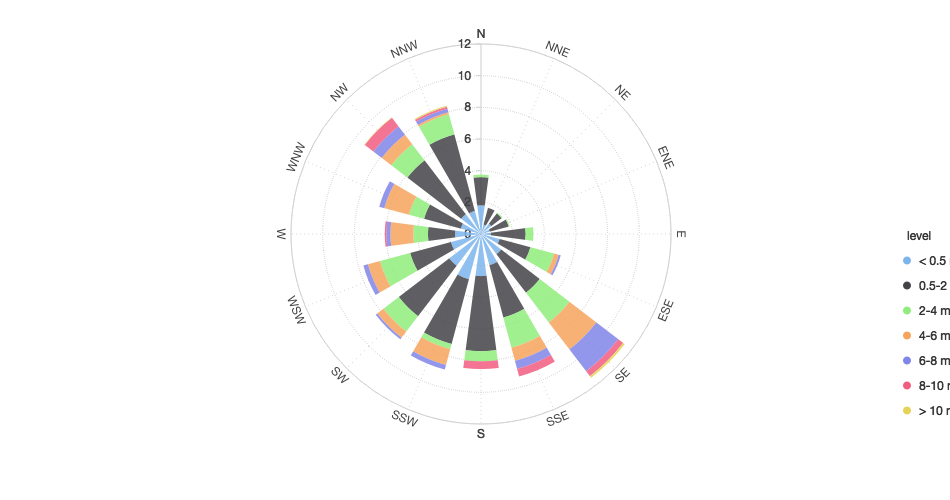
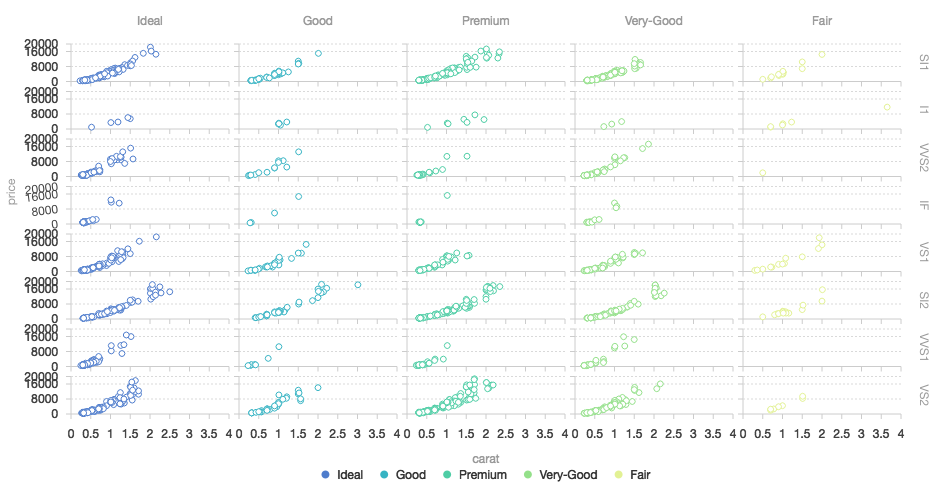
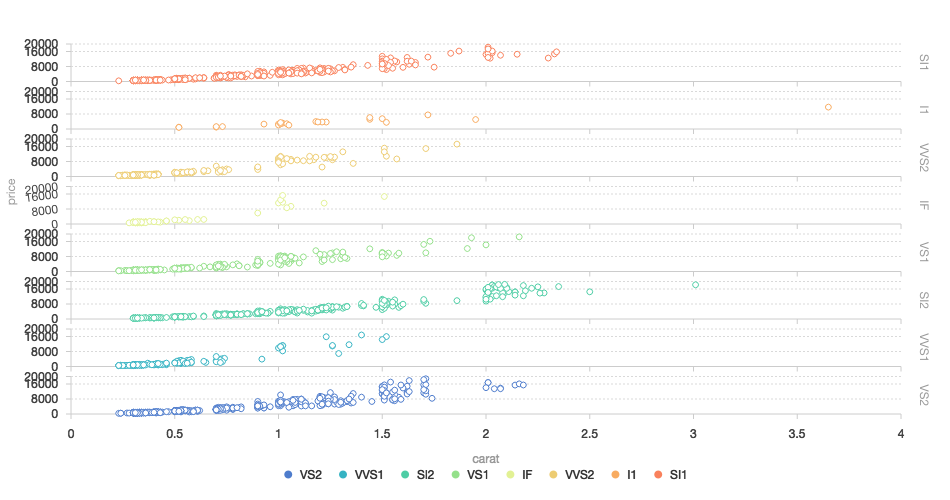
分面
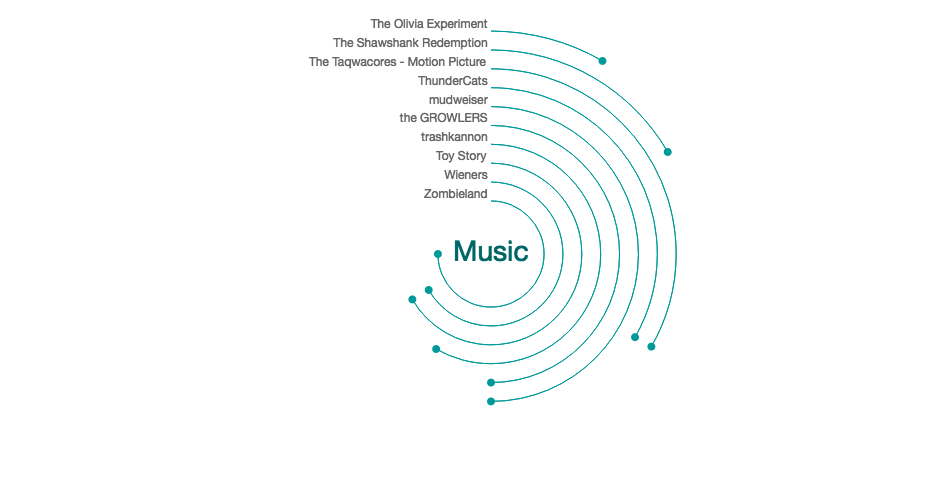
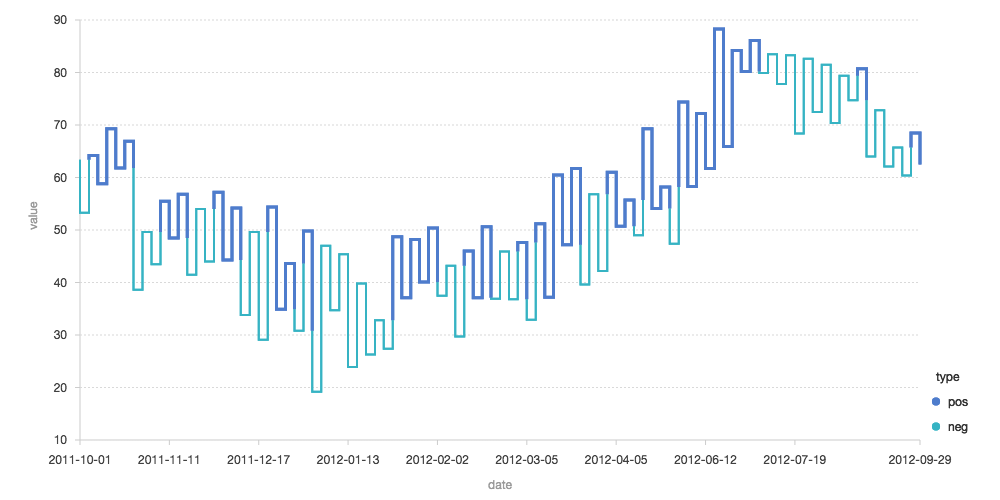
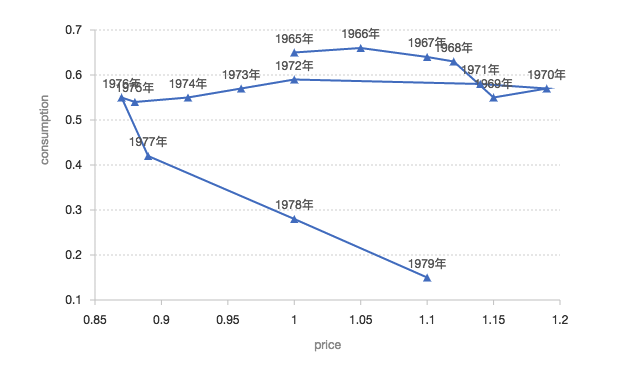
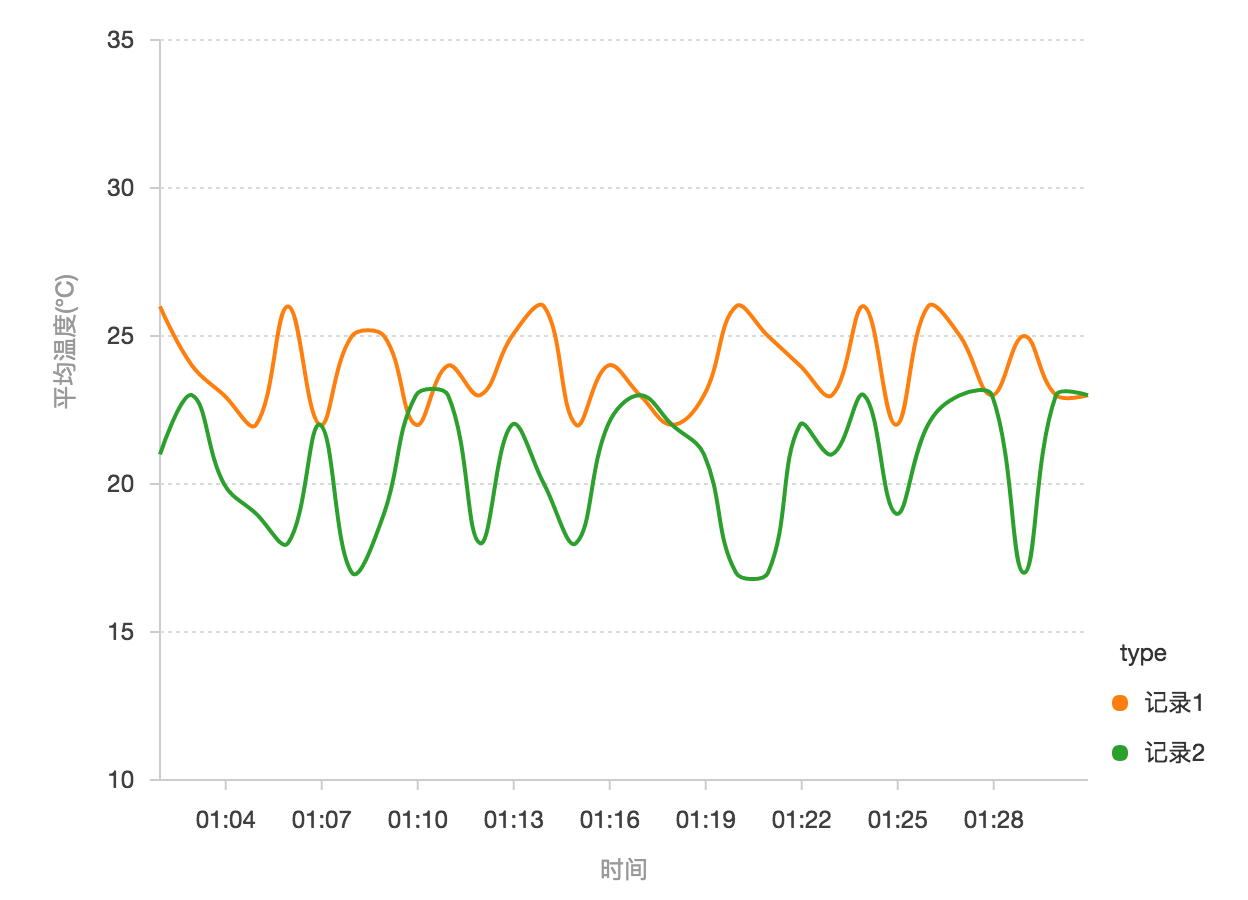
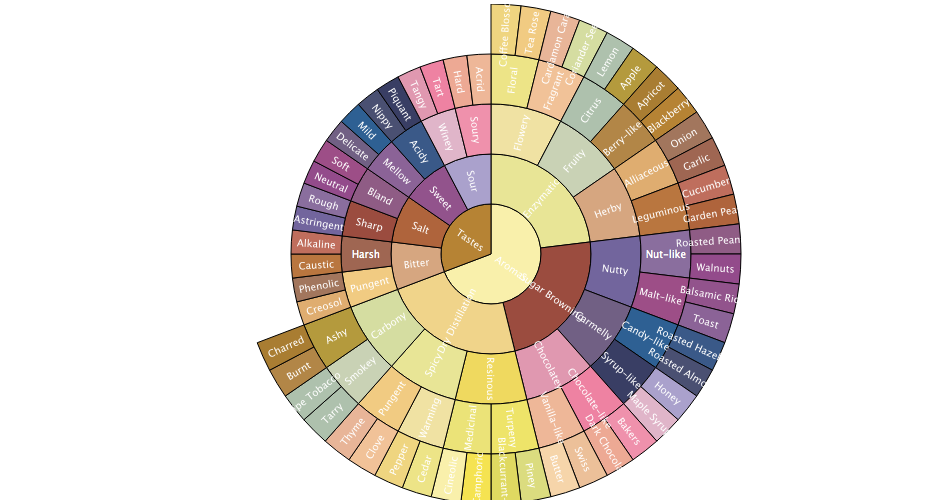
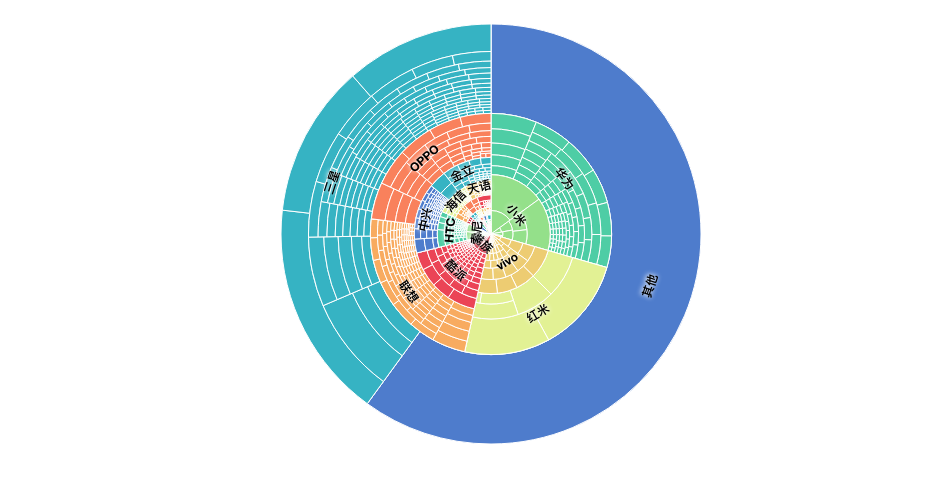
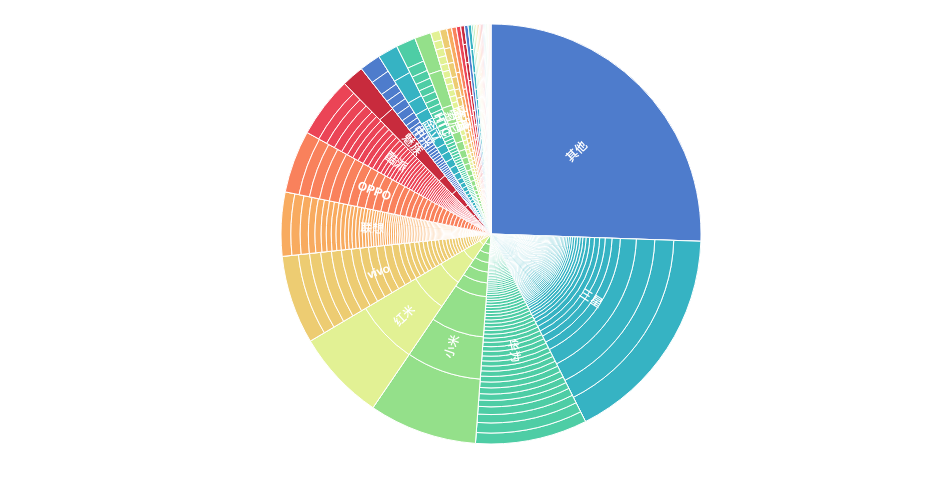
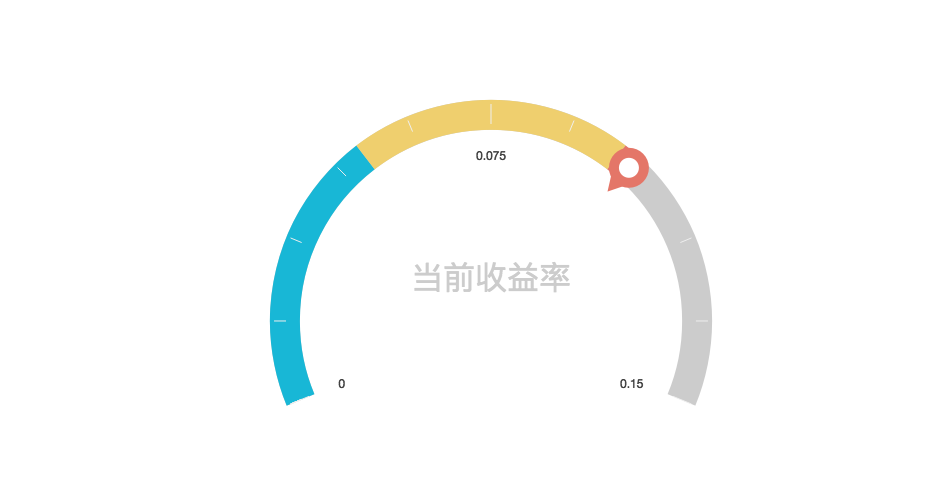
其他图表
gallery
源码
g2-react
运行
复制
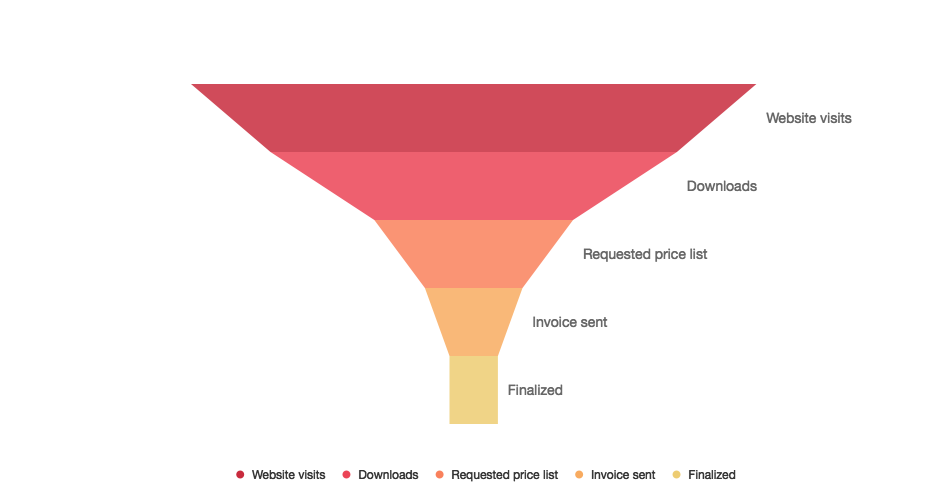
<!DOCTYPE html> <html> <head> <meta charset="utf-8"> <title>漏斗图</title> <script src="https://a.alipayobjects.com/jquery/jquery/1.11.1/jquery.js"></script> <script src="https://gw.alipayobjects.com/as/g/datavis/g2/2.3.13/index.js"></script> </head> <body> <div id="c1"></div> <script> var data = [ {"action": "Website visits", "value": 5654}, {"action": "Downloads", "value": 4064}, {"action": "Requested price list", "value": 1987}, {"action": "Invoice sent", "value": 976}, {"action": "Finalized", "value": 484} ]; var chart = new G2.Chart({ id: 'c1', forceFit: true, height: 450, plotCfg: { margin: 80 } }); chart.source(data); chart.coord('rect').transpose().scale(1,-1); chart.axis(false); chart.legend('action', { position: 'bottom' }); chart.intervalSymmetric() .position('action*value') .color('action', ['#C82B3D', '#EB4456', '#F9815C', '#F8AB60', '#EDCC72']) .shape('funnel') .label('action', {offset: 10, label: {fontSize: 14}}).animate({ appear:{ animation:'zoomIn' }, leave:{ animation:'fadeIn', easing:'easeInQuart' } }); chart.render(); </script> </body> </html>
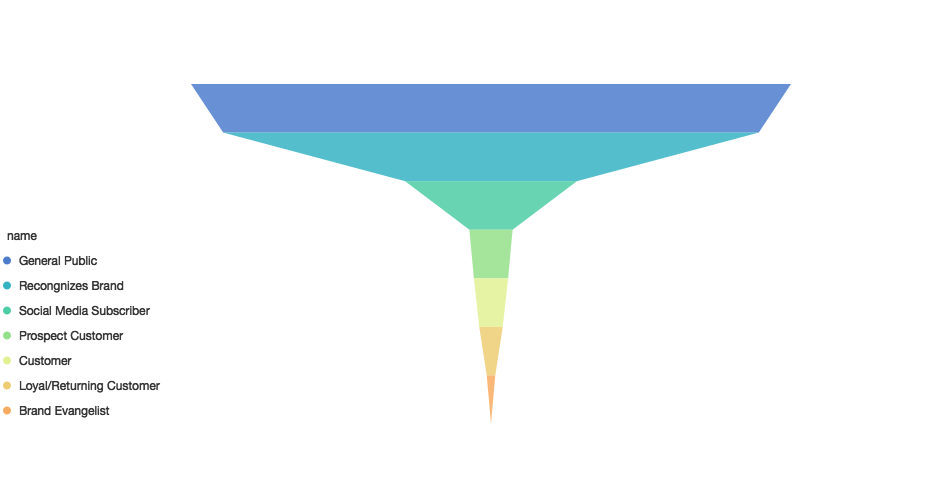
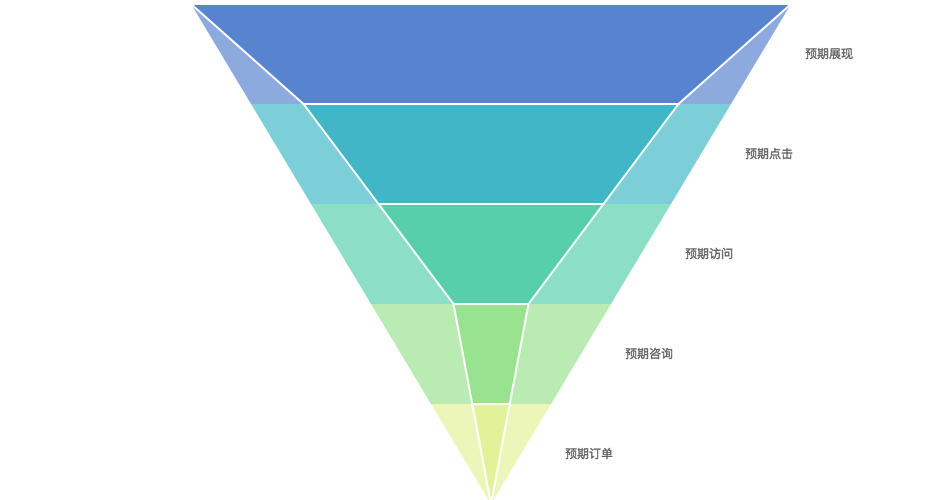
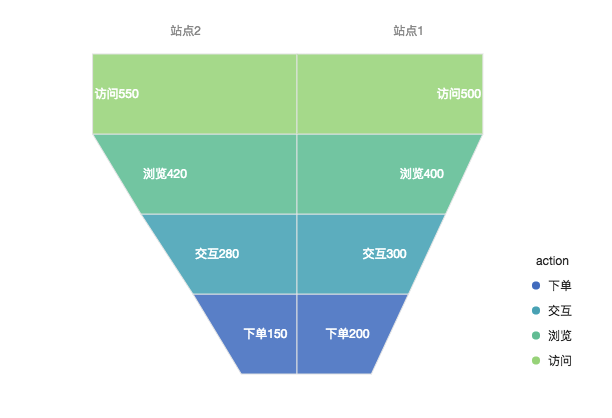
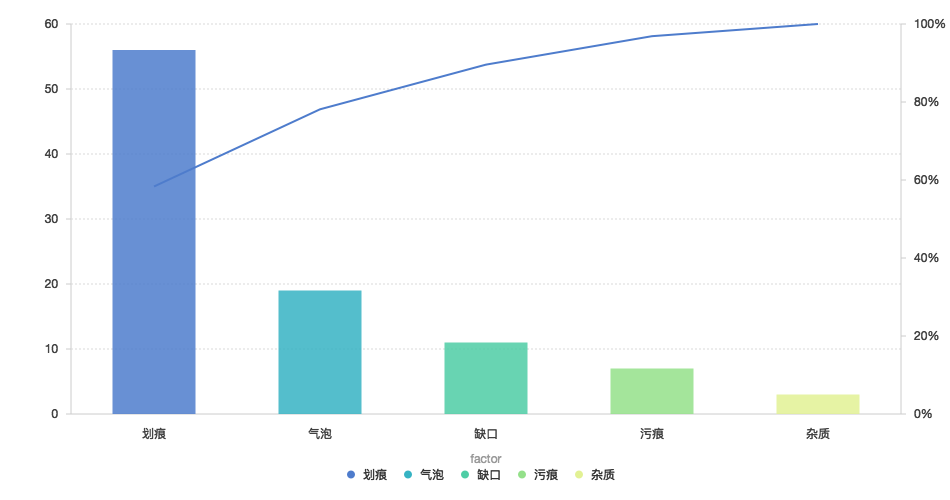
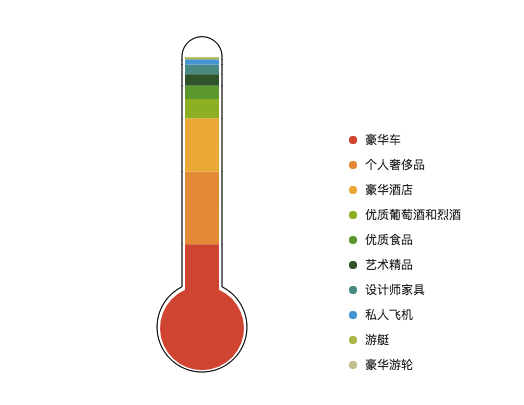
漏斗图
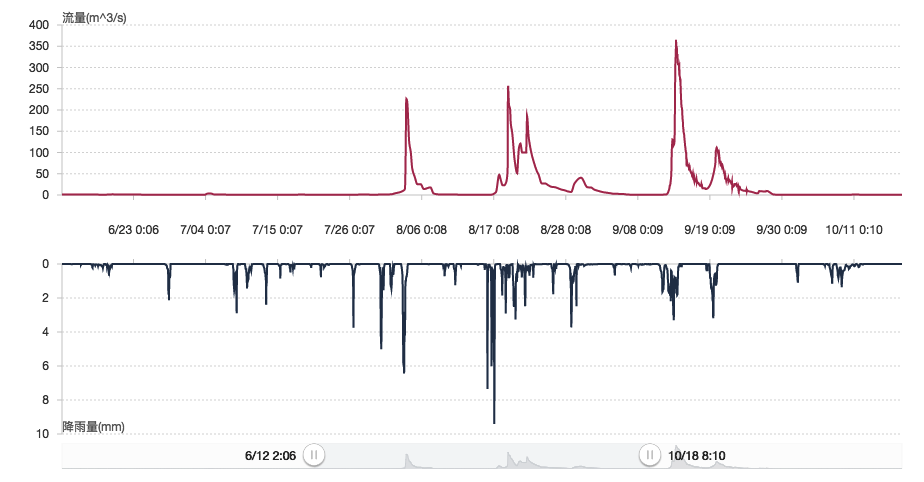
漏斗图适用于业务流程比较规范、周期长、环节多的单流程单向分析,通过漏斗各环节业务数据的比较能够直观地发现和说明问题所在的环节,进而做出决策。
了解更多
<!DOCTYPE html> <html> <head> <meta charset="utf-8"> <title>漏斗图</title> <script src="https://unpkg.com/react@15/dist/react.min.js"></script> <script src="https://unpkg.com/react-dom@15/dist/react-dom.min.js"></script> <script src="https://a.alipayobjects.com/g/datavis/g2/2.3.13/g2.js"></script> <script src="https://unpkg.com/g2-react@1.2.0/dist/index.js"></script> <script src="https://cdn.bootcss.com/babel-core/5.8.38/browser.min.js"></script> <script src="https://unpkg.com/axios/dist/axios.min.js"></script> </head> <body> <div id="c1"></div> <script type="text/babel"> const Chart = createG2(chart => { chart.coord('rect').transpose().scale(1,-1); chart.axis(false); chart.legend('action', { position: 'bottom' }); chart.intervalSymmetric() .position('action*value') .color('action', ['#C82B3D', '#EB4456', '#F9815C', '#F8AB60', '#EDCC72']) .shape('funnel') .label('action', {offset: 10, label: {fontSize: 14}}); chart.render(); }); const MyComponent = React.createClass({ getInitialState() { return { data: [ {"action": "Website visits", "value": 5654}, {"action": "Downloads", "value": 4064}, {"action": "Requested price list", "value": 1987}, {"action": "Invoice sent", "value": 976}, {"action": "Finalized", "value": 484} ], forceFit: true, width: 500, height: 450, plotCfg: { margin: 80 }, }; }, render() { return ( <div> <Chart data={this.state.data} width={this.state.width} height={this.state.height} plotCfg={this.state.plotCfg} forceFit={this.state.forceFit} /> </div> ); }, }); ReactDOM.render(<MyComponent />, document.getElementById('c1')); </script> </body> </html>