G2
图表示例
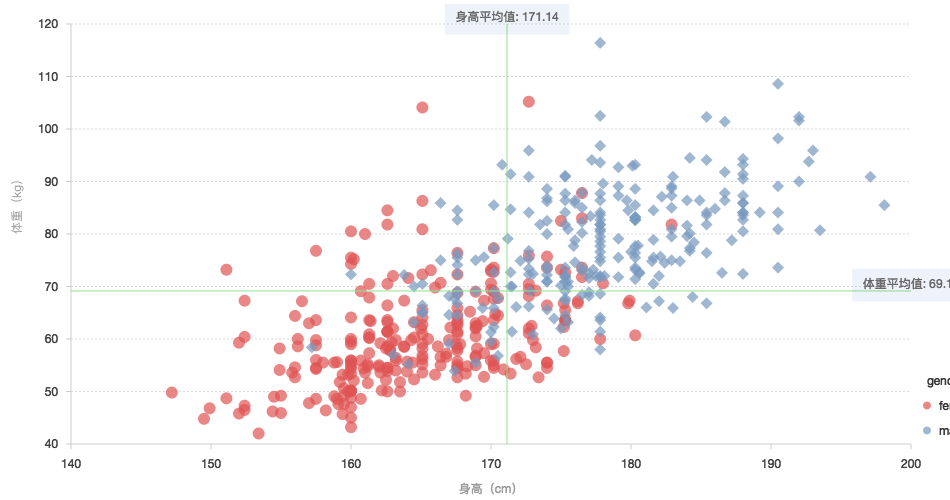
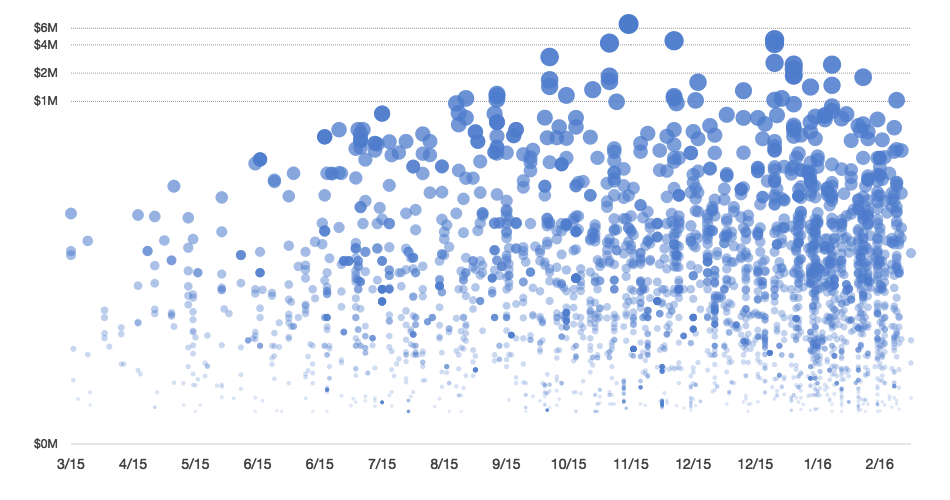
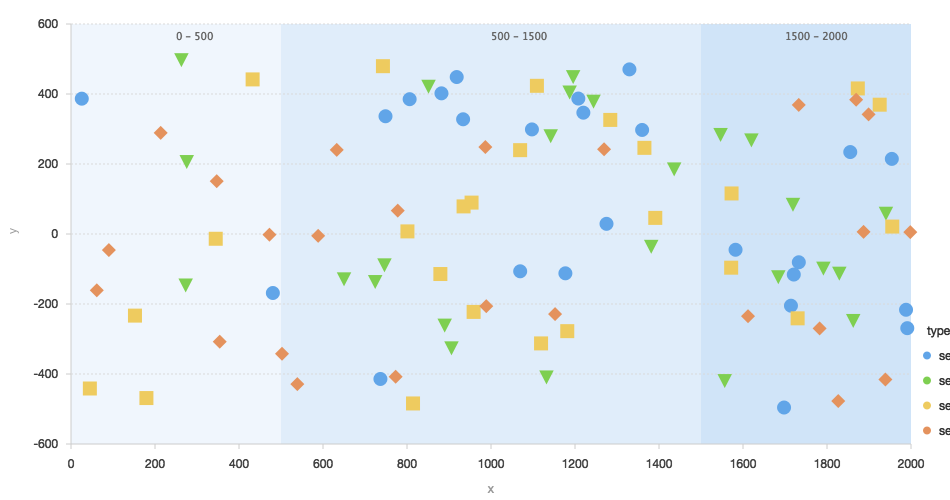
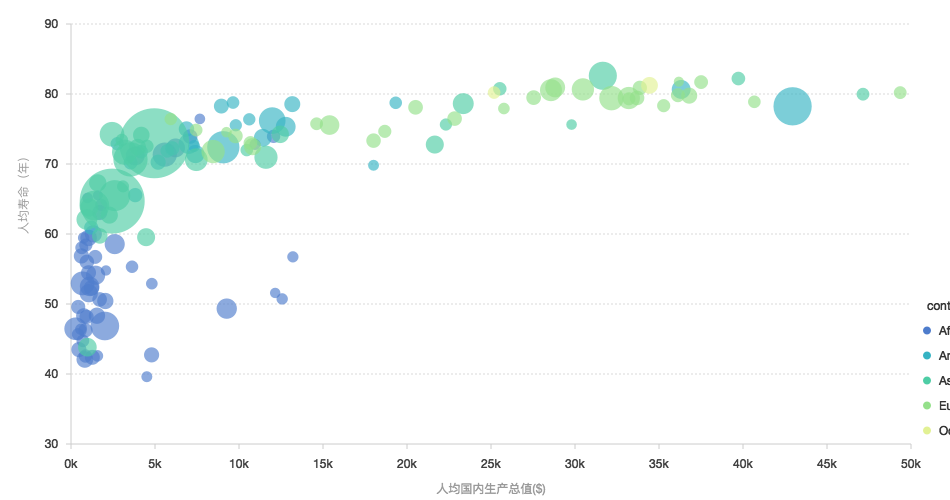
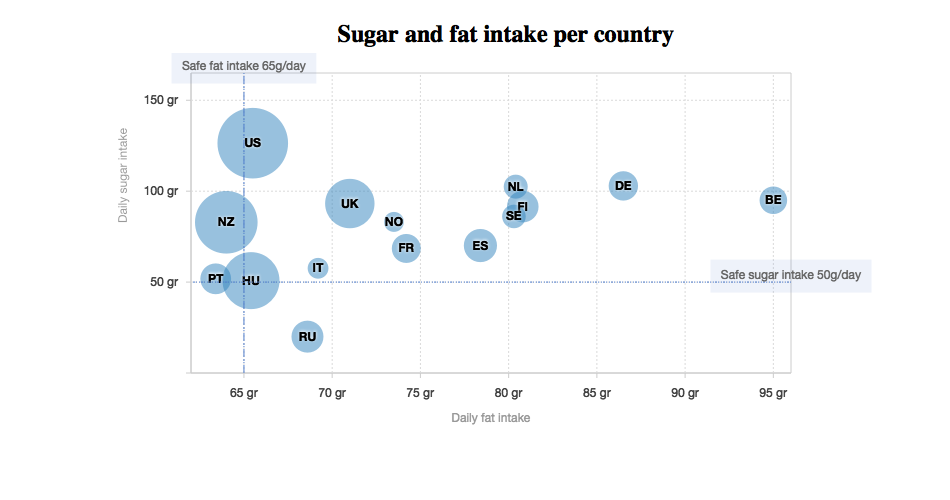
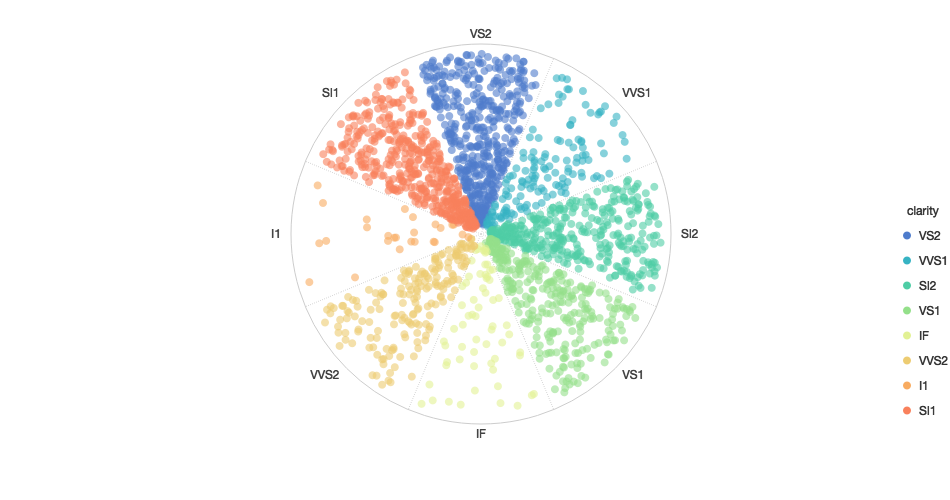
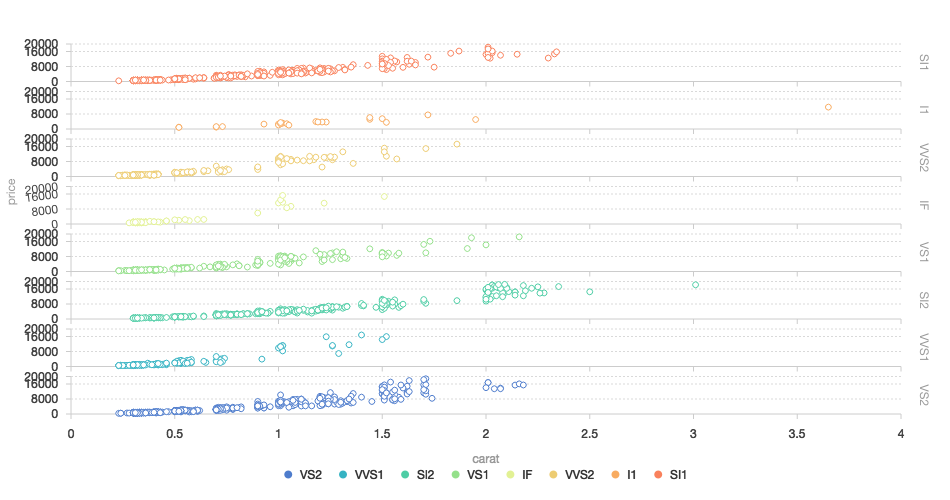
点图
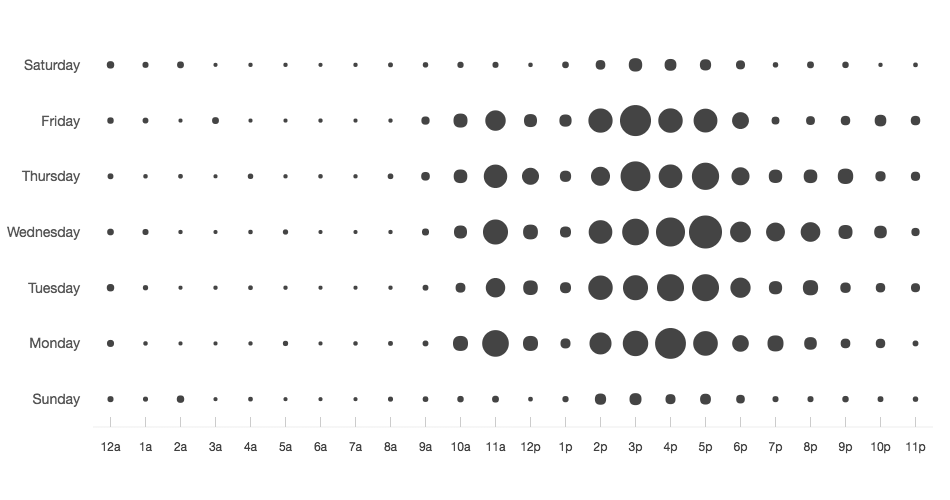
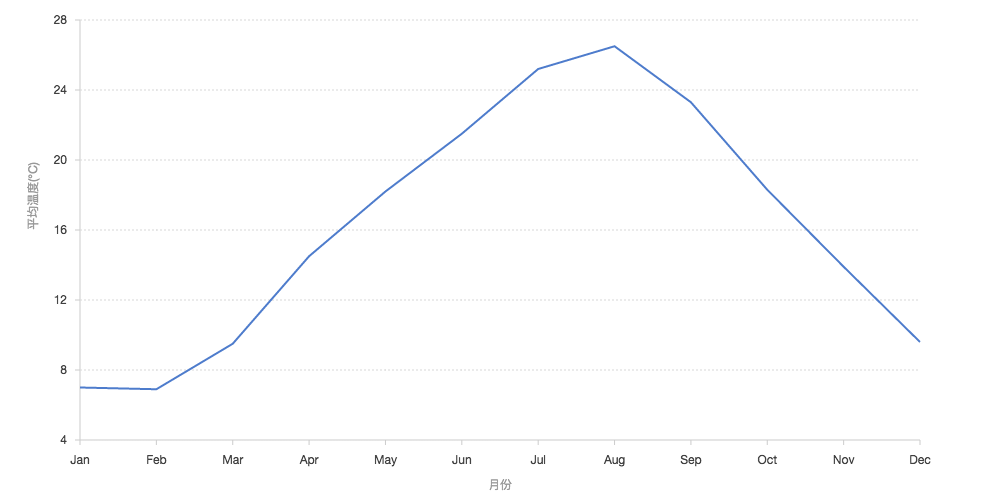
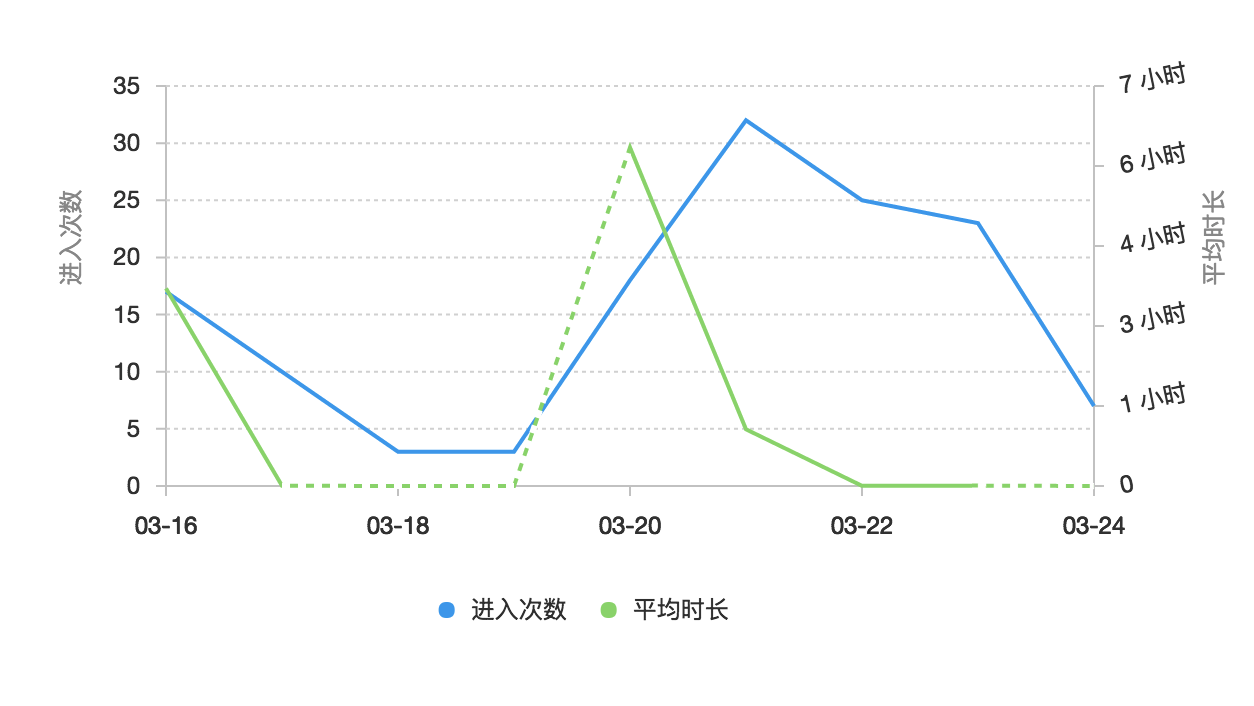
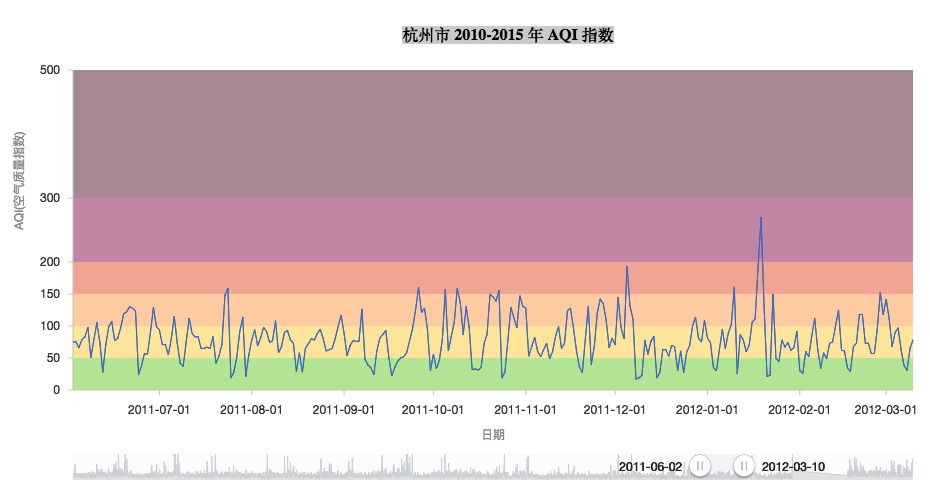
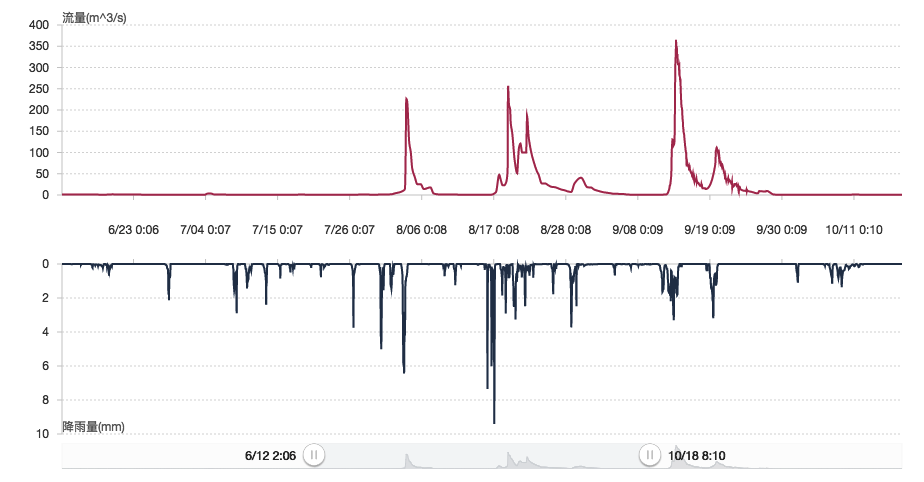
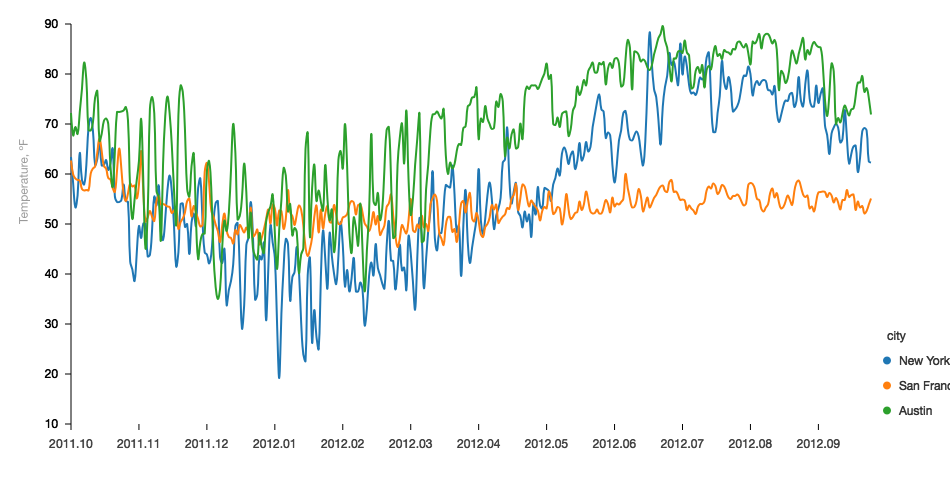
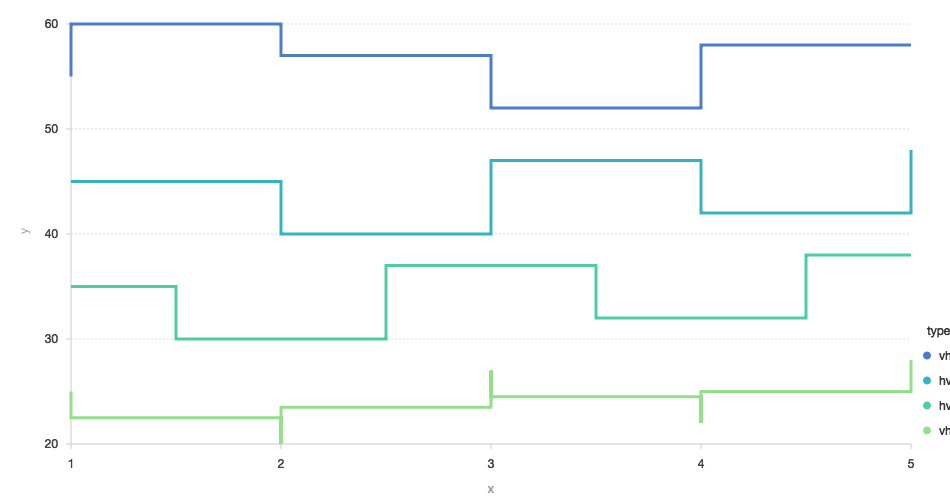
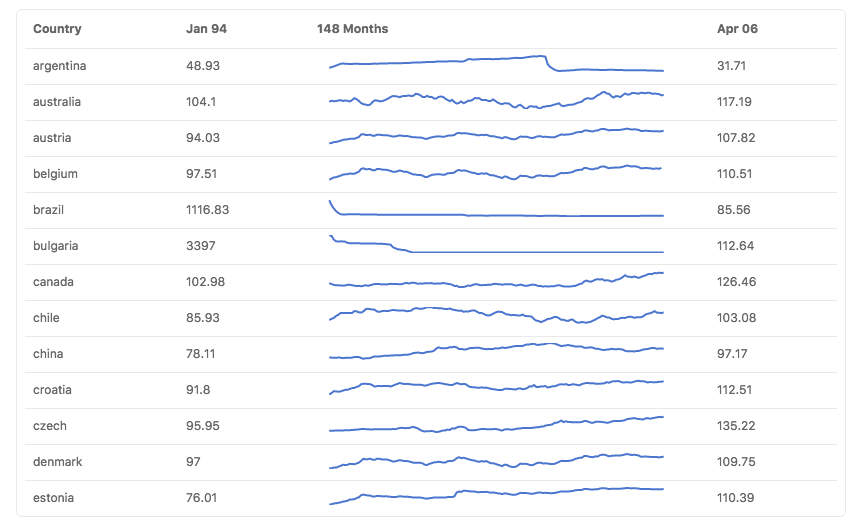
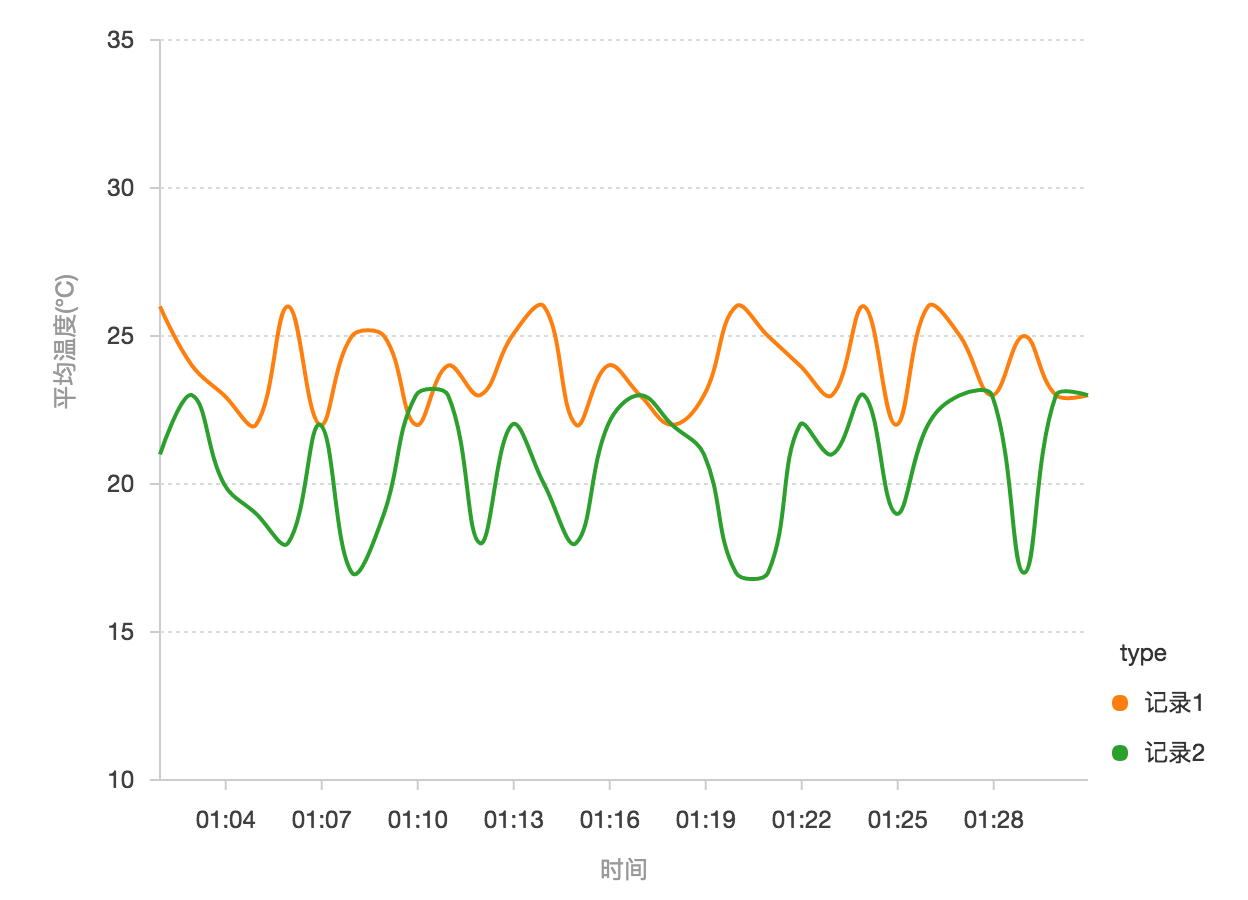
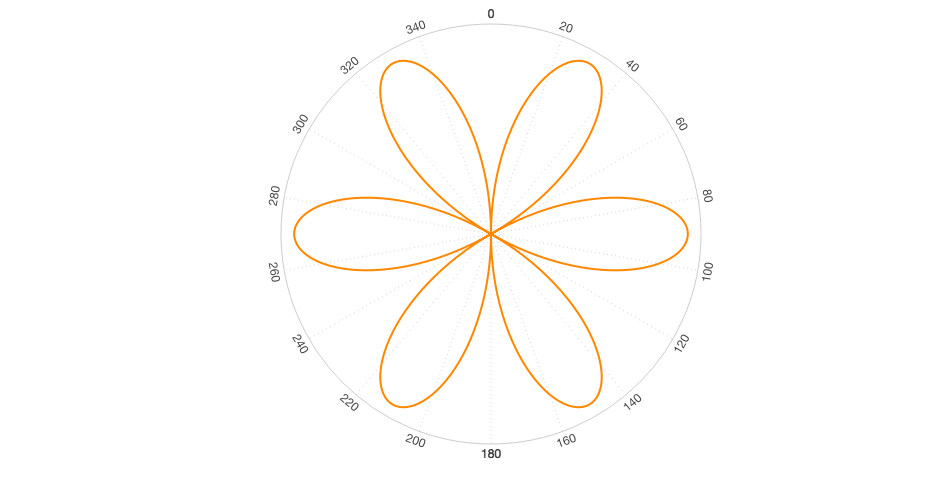
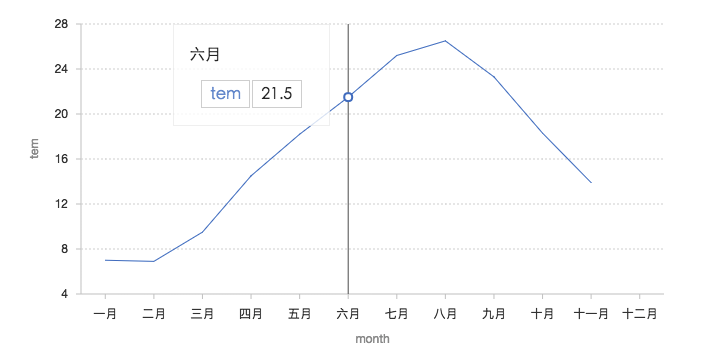
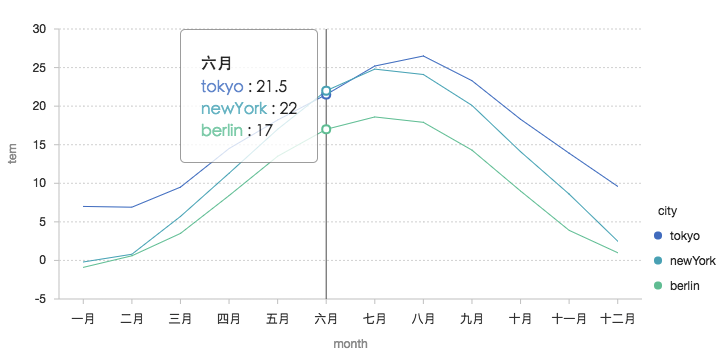
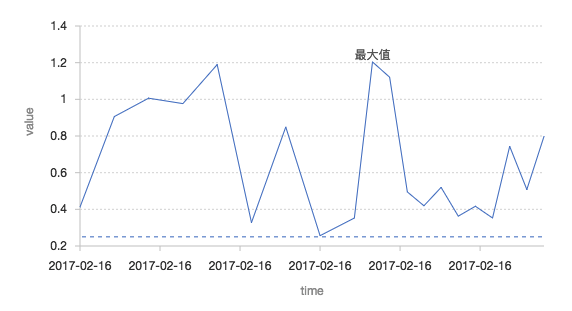
线图
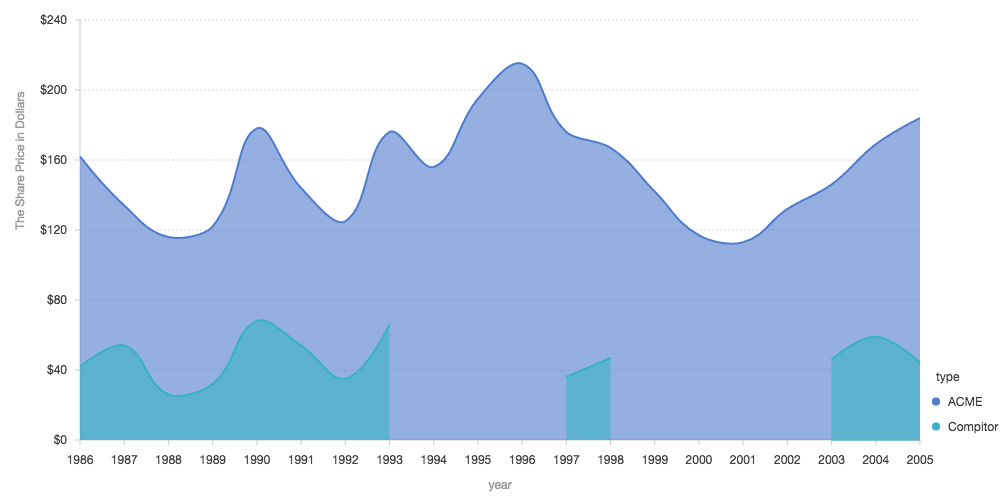
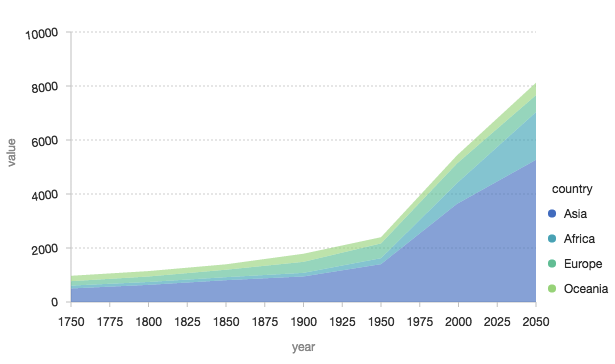
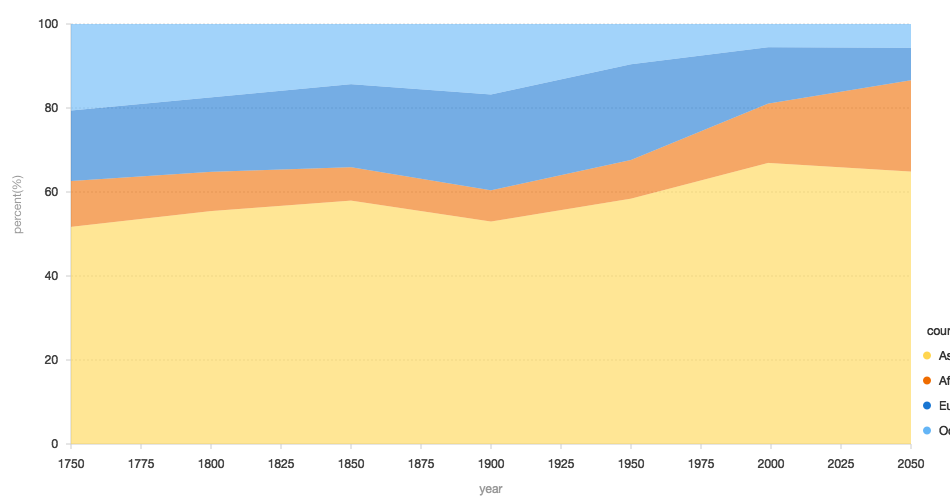
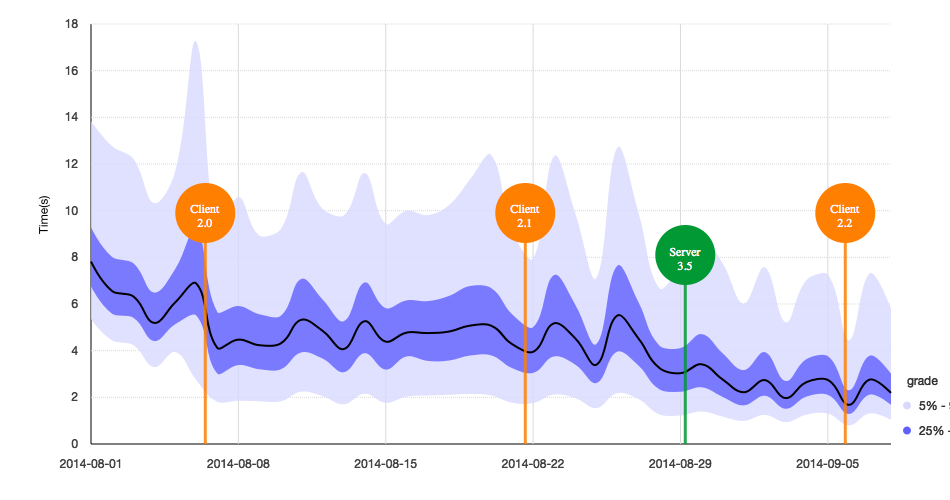
区域图
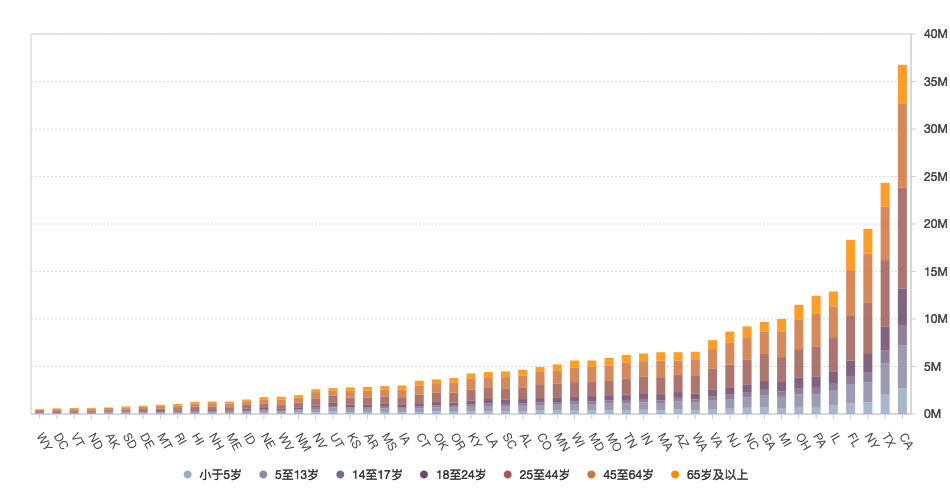
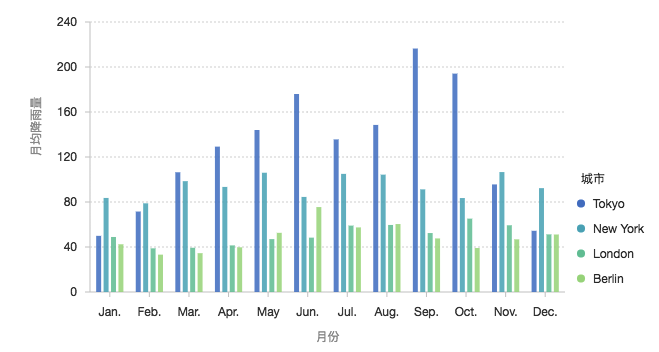
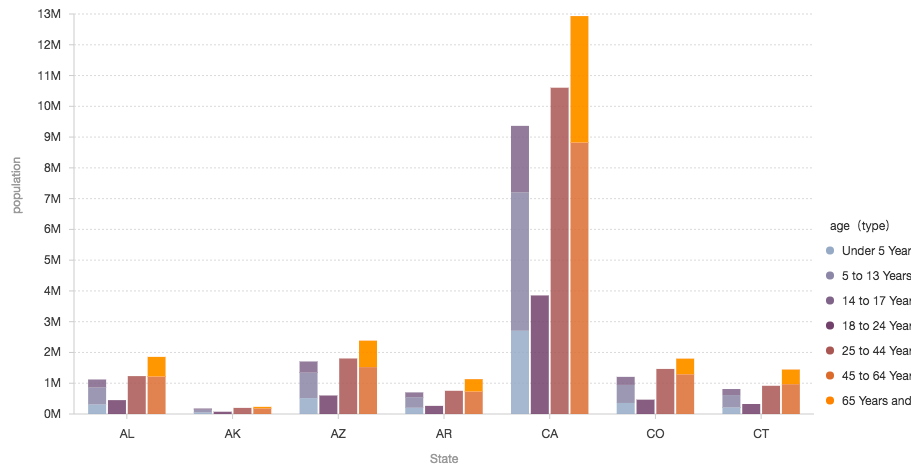
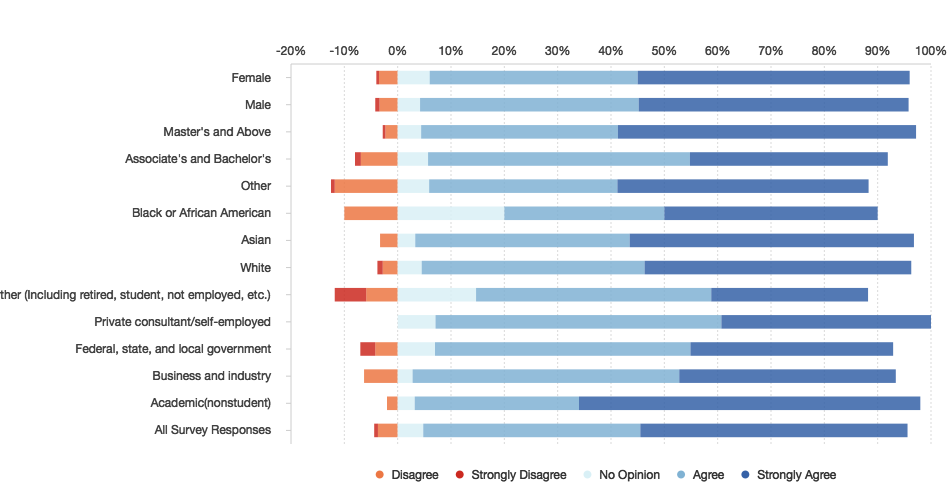
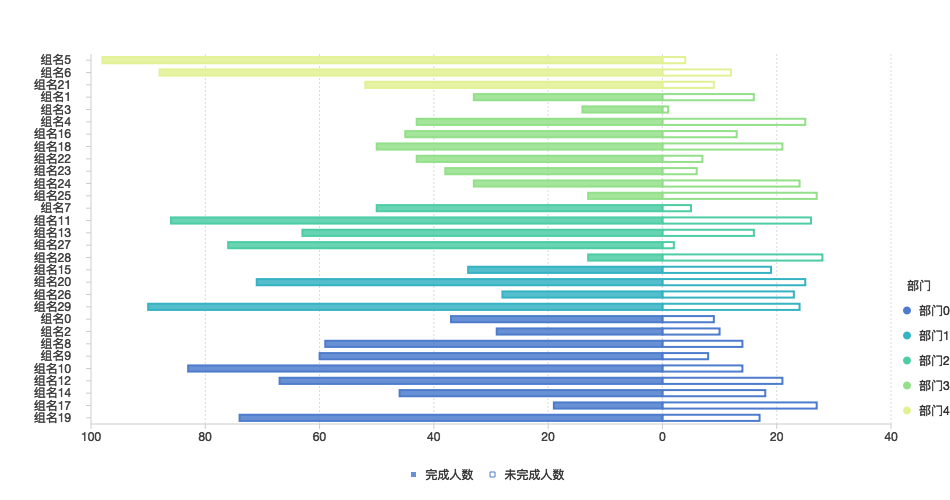
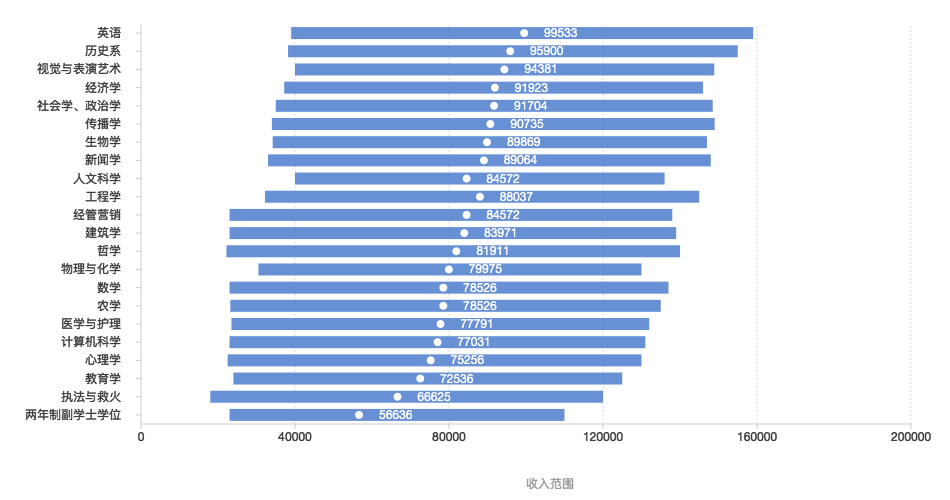
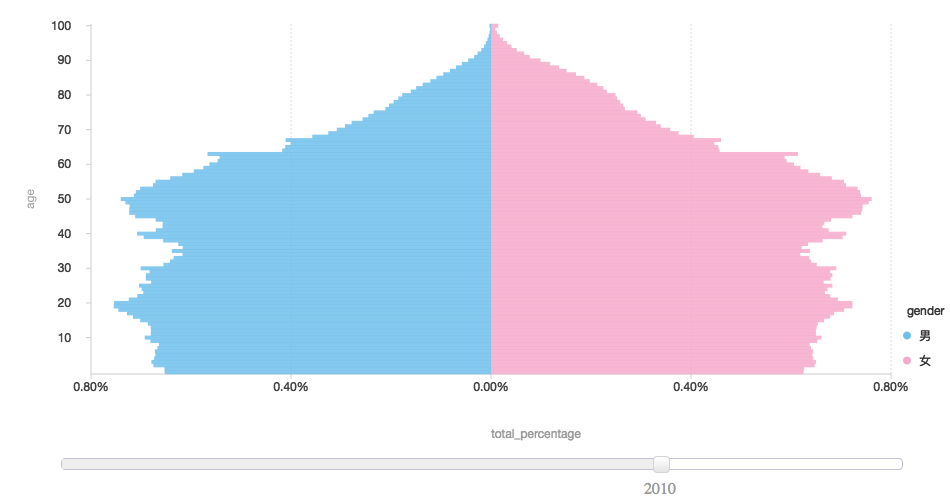
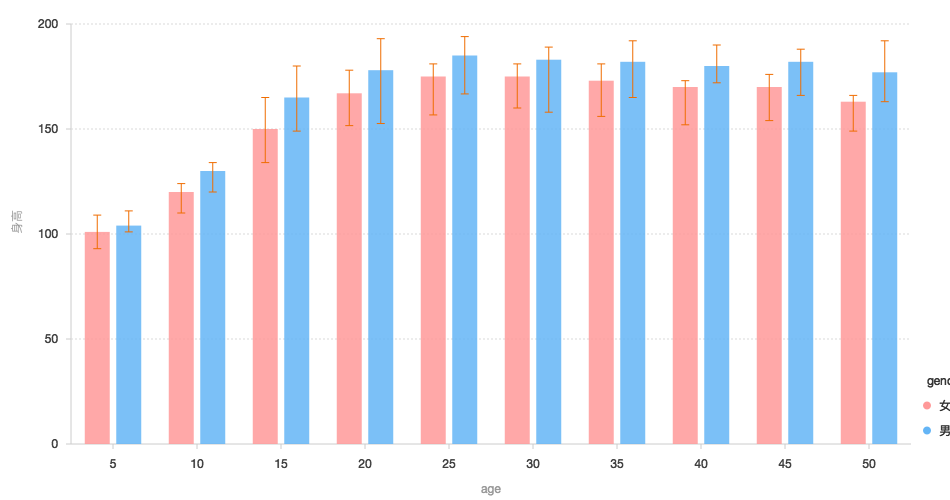
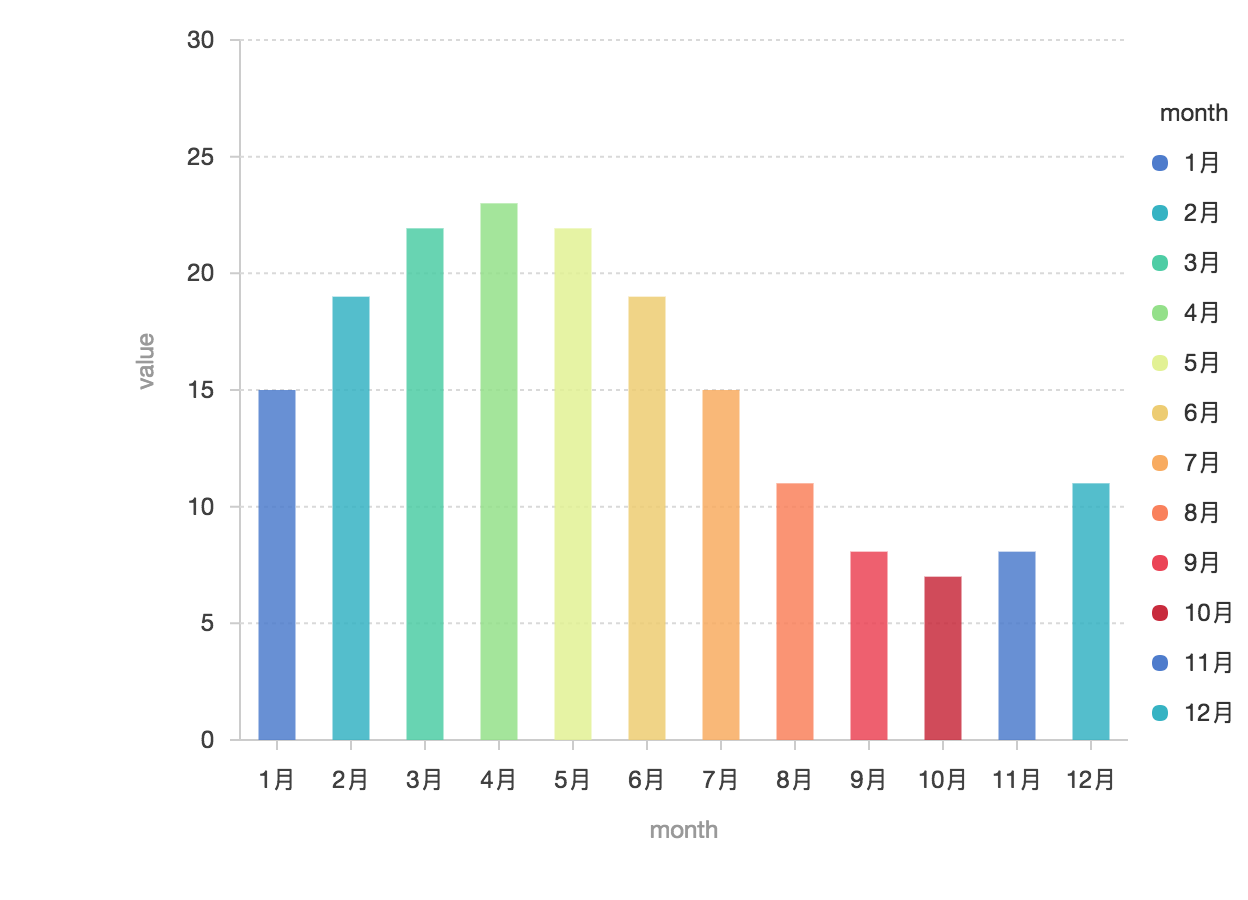
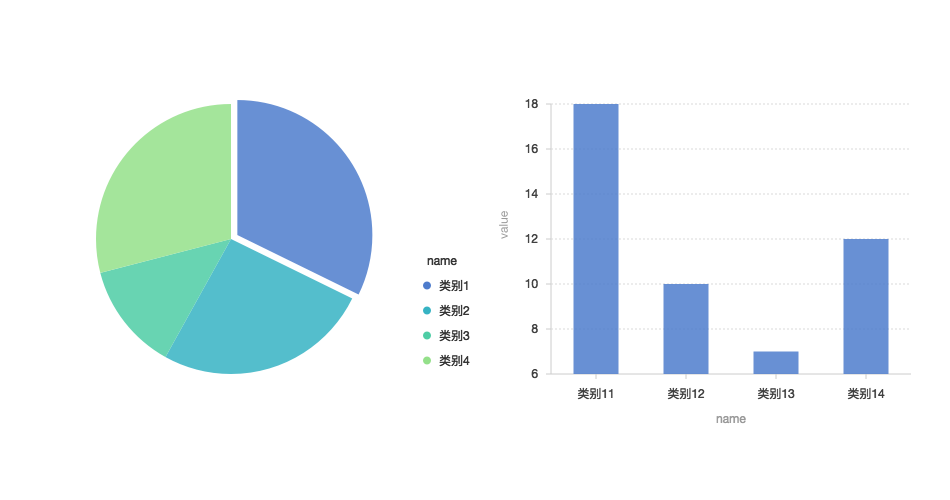
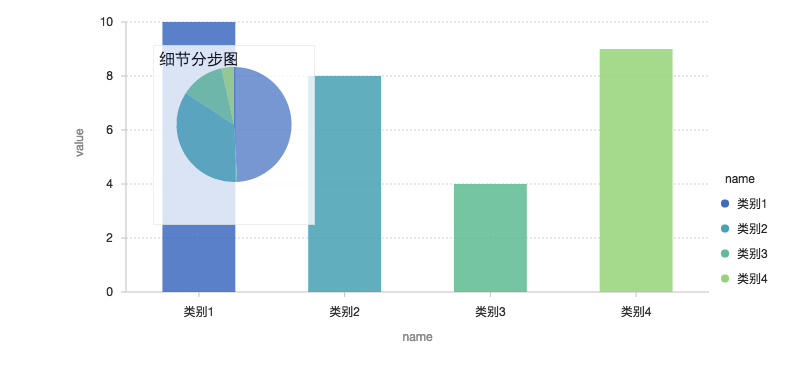
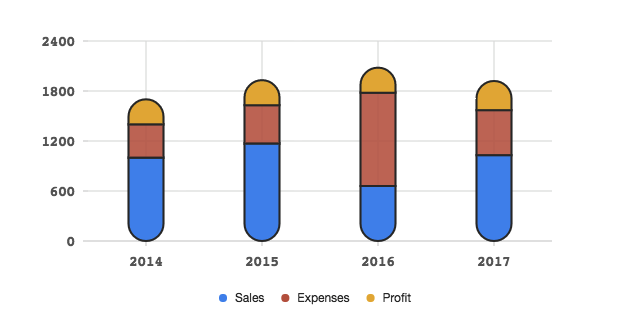
柱状图
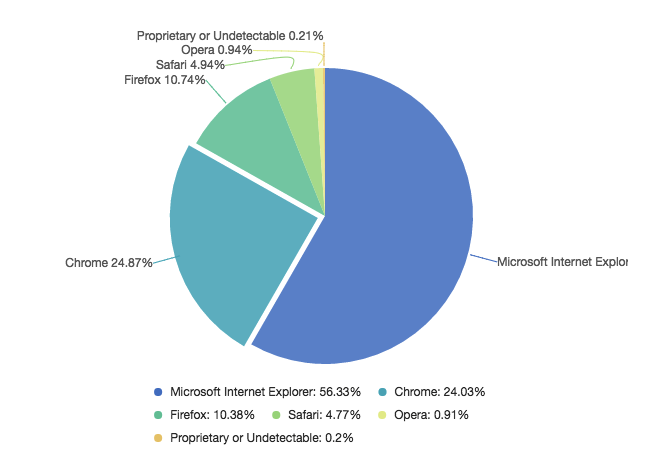
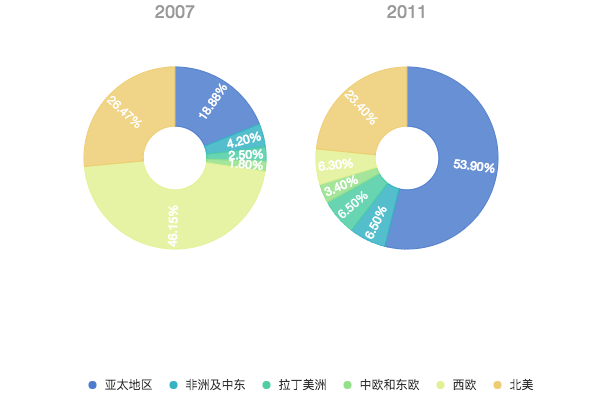
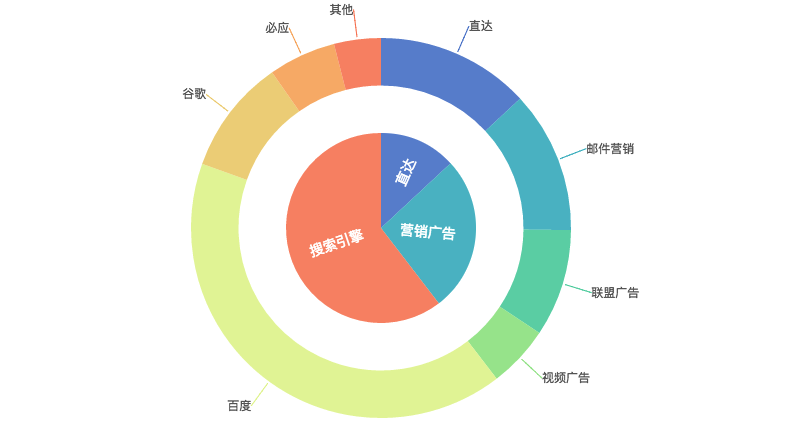
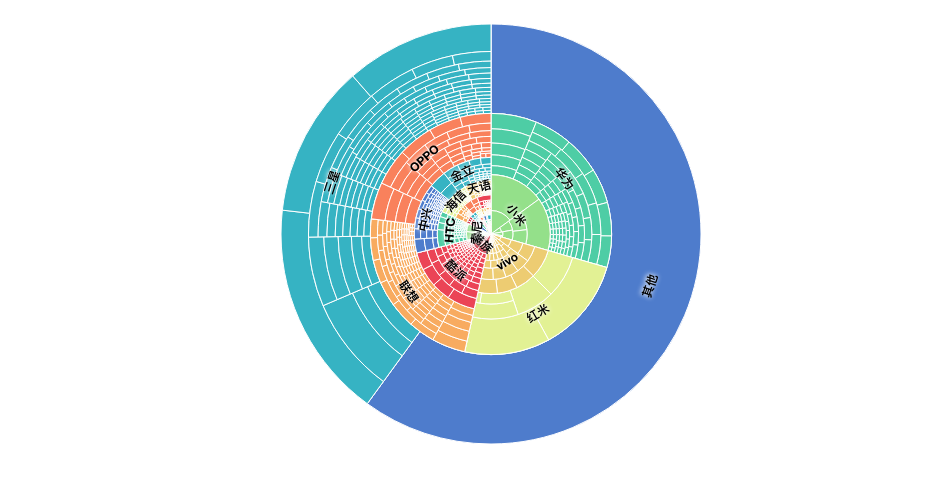
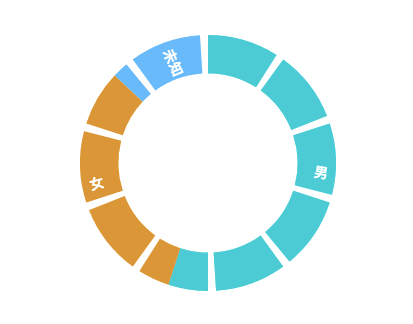
饼图
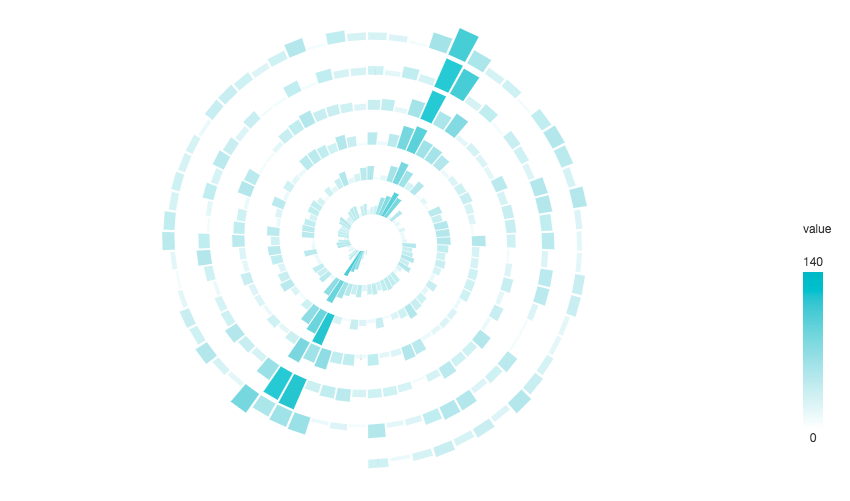
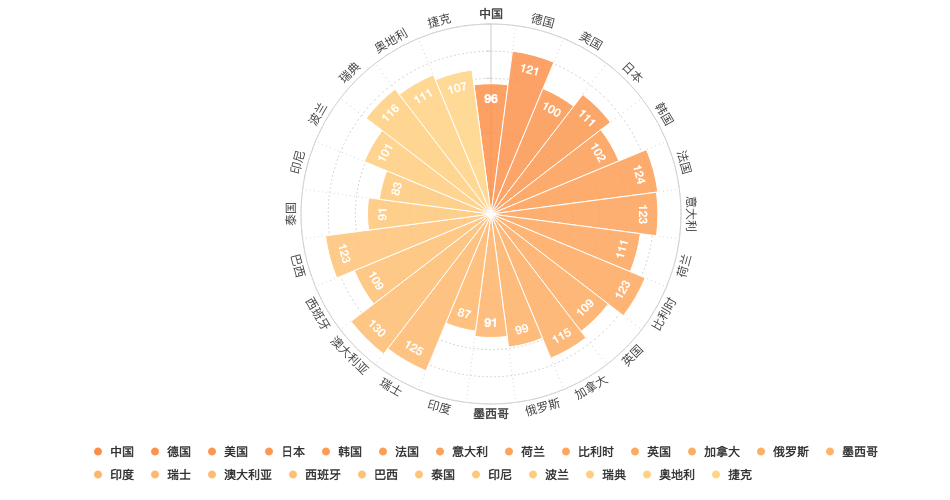
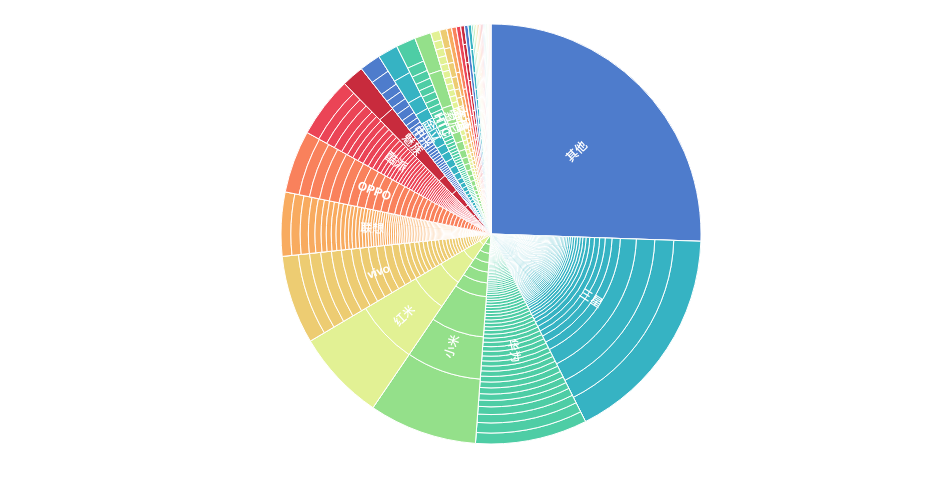
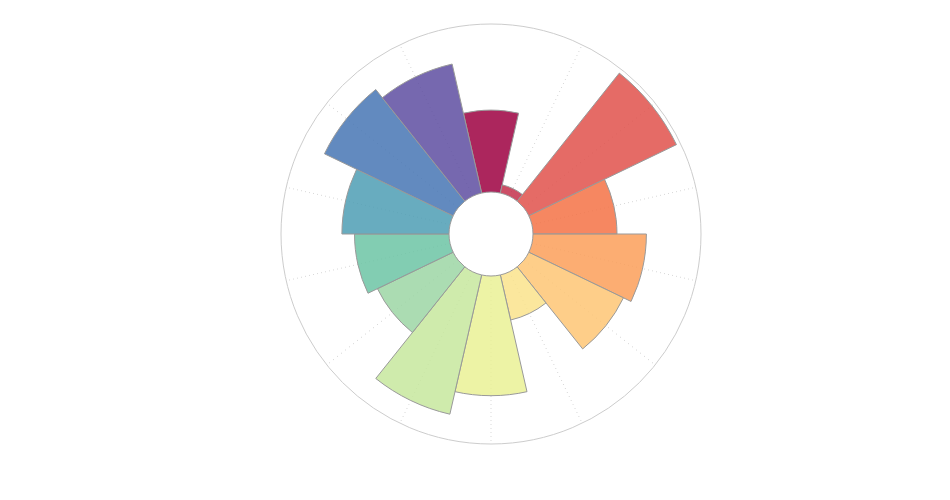
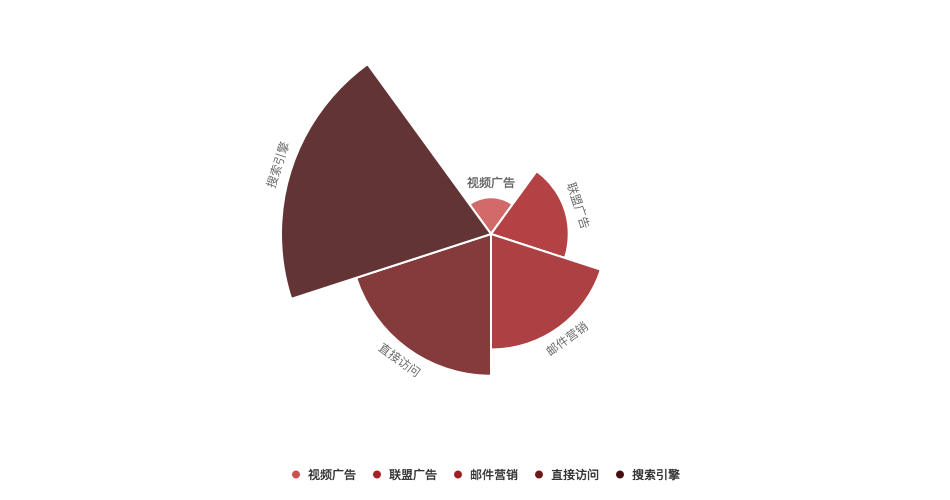
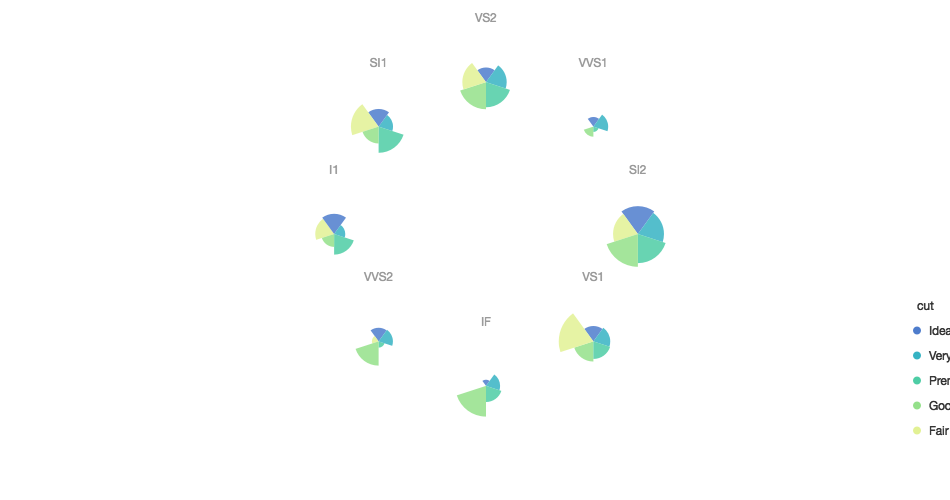
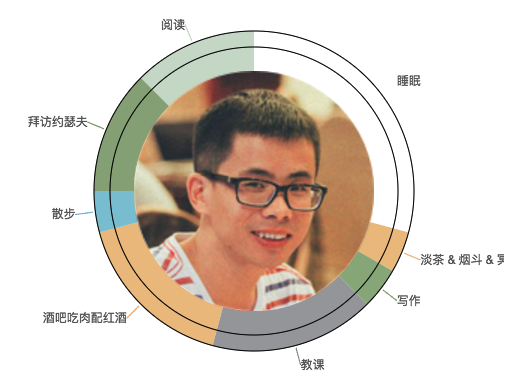
南丁格尔玫瑰图
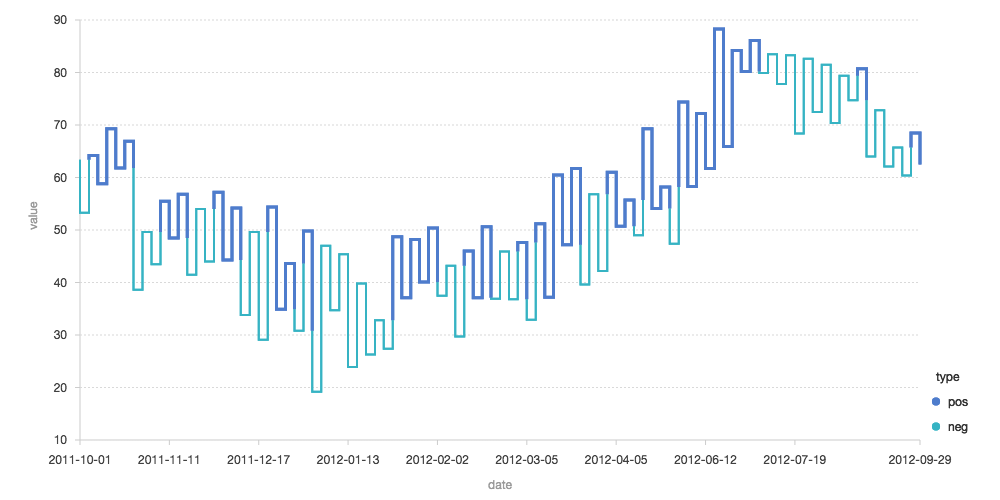
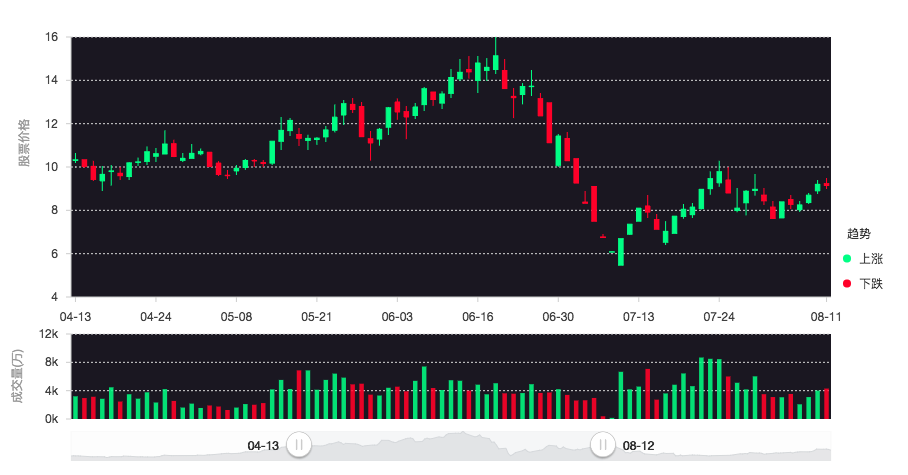
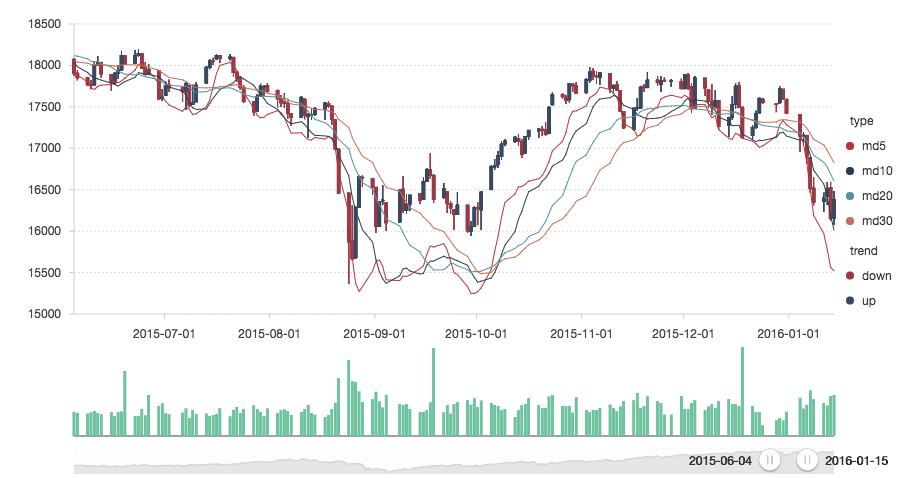
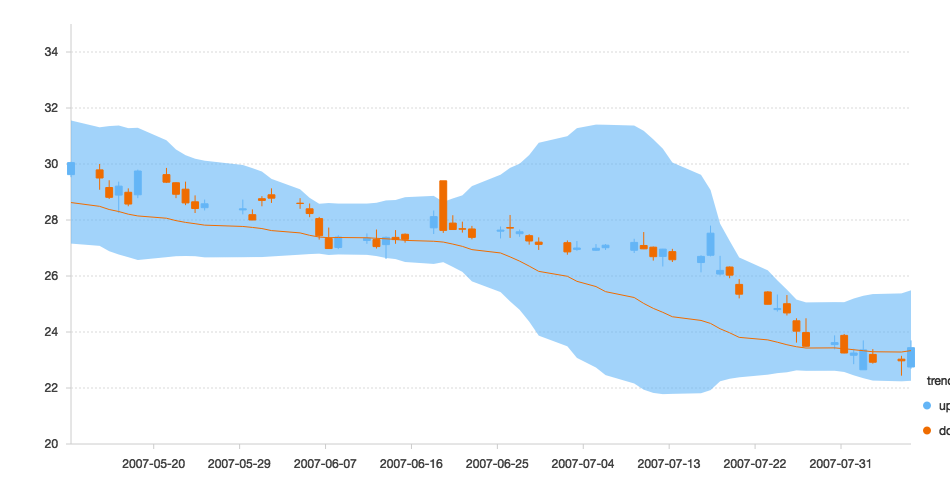
股票图
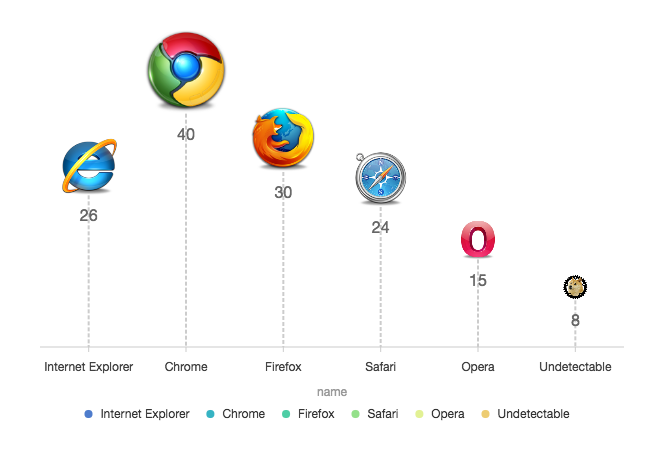
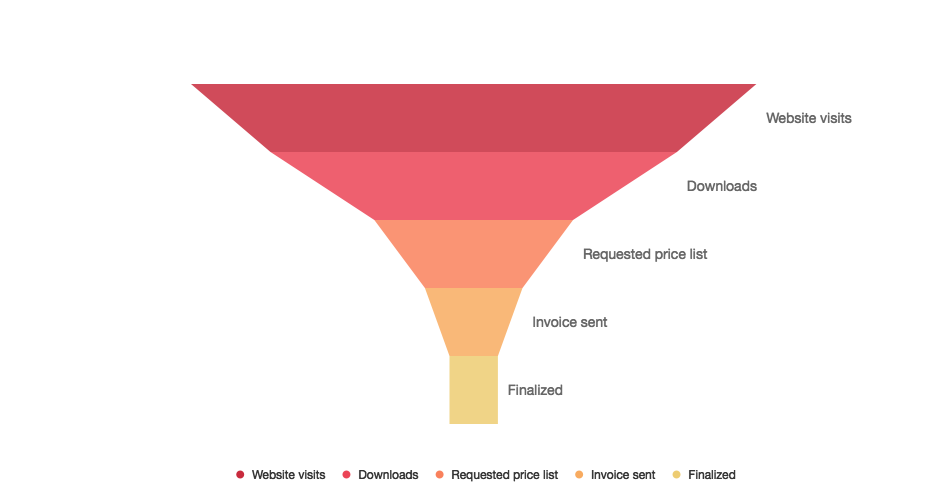
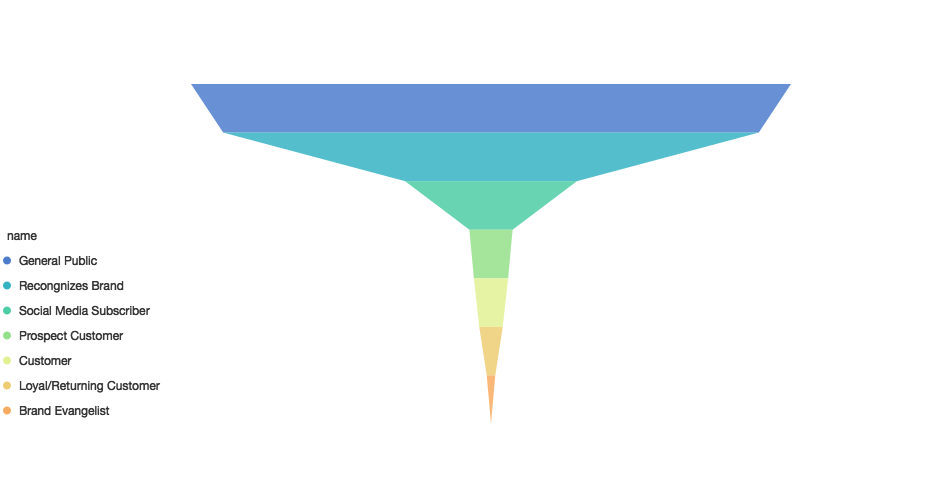
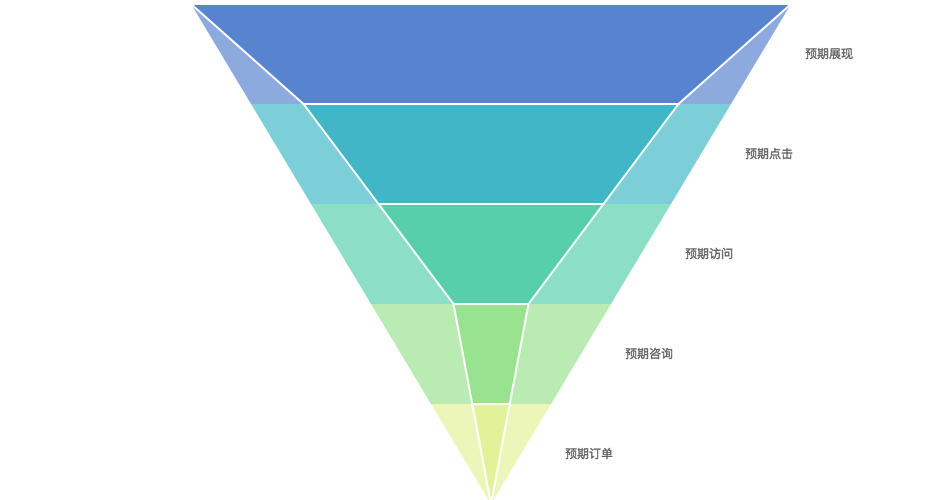
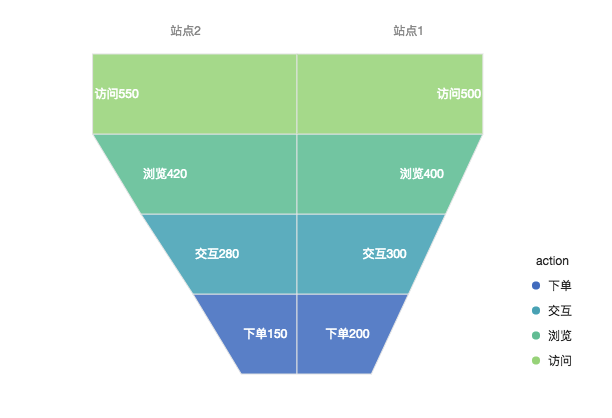
漏斗图
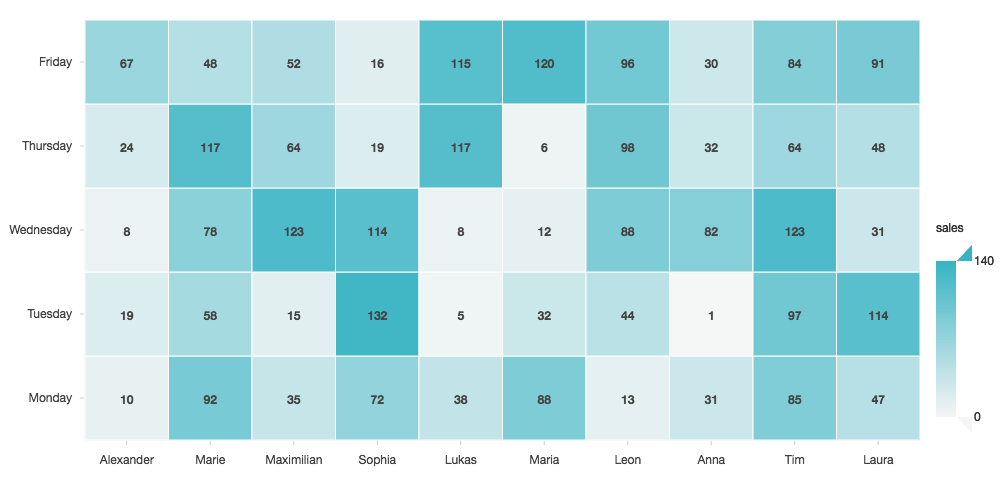
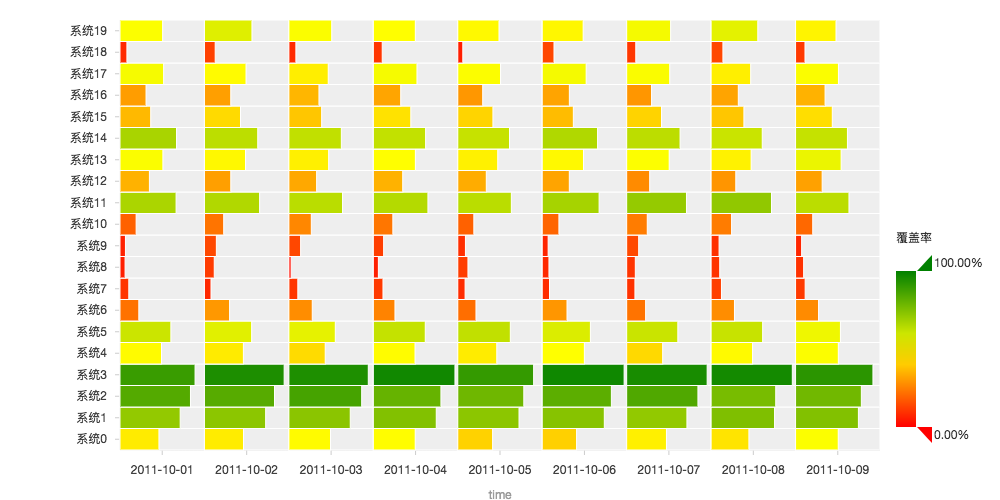
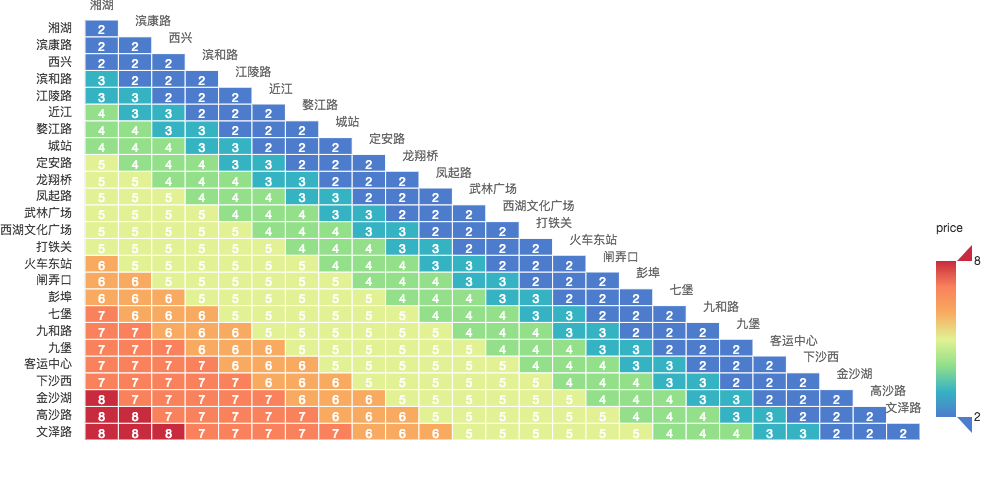
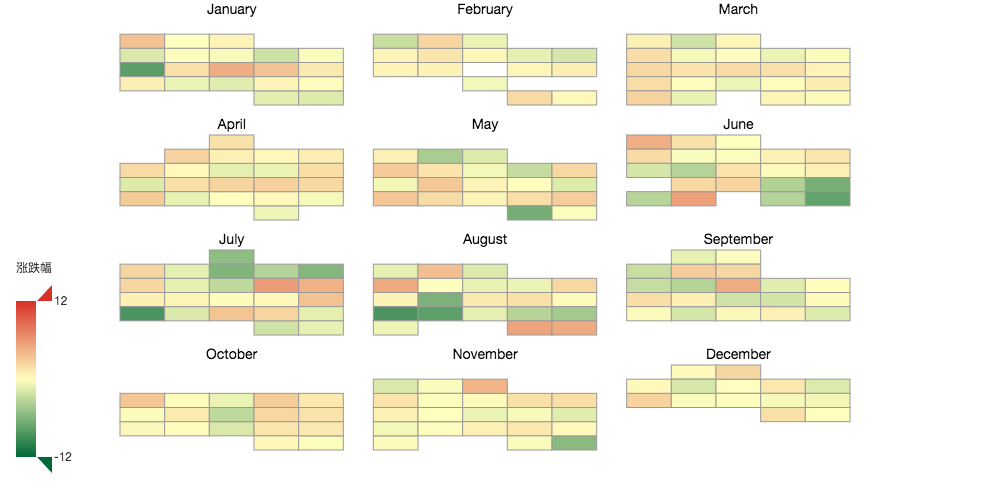
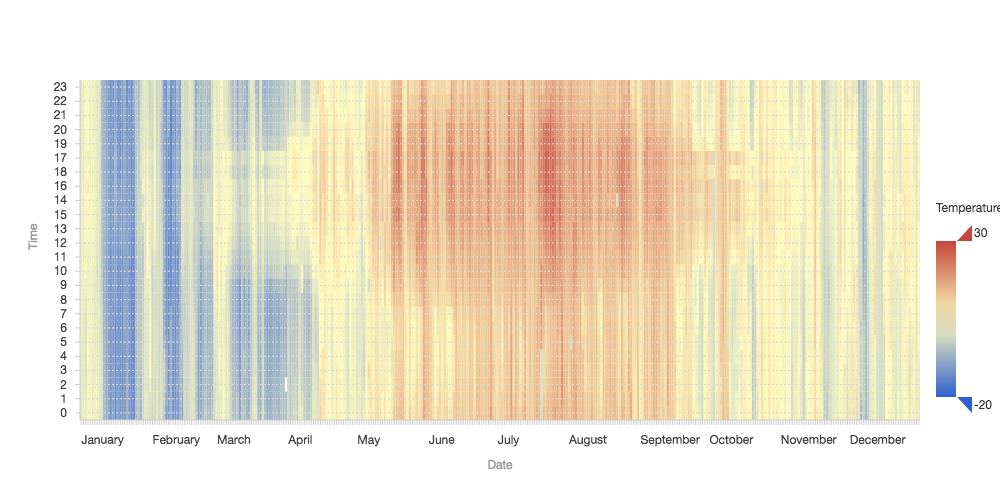
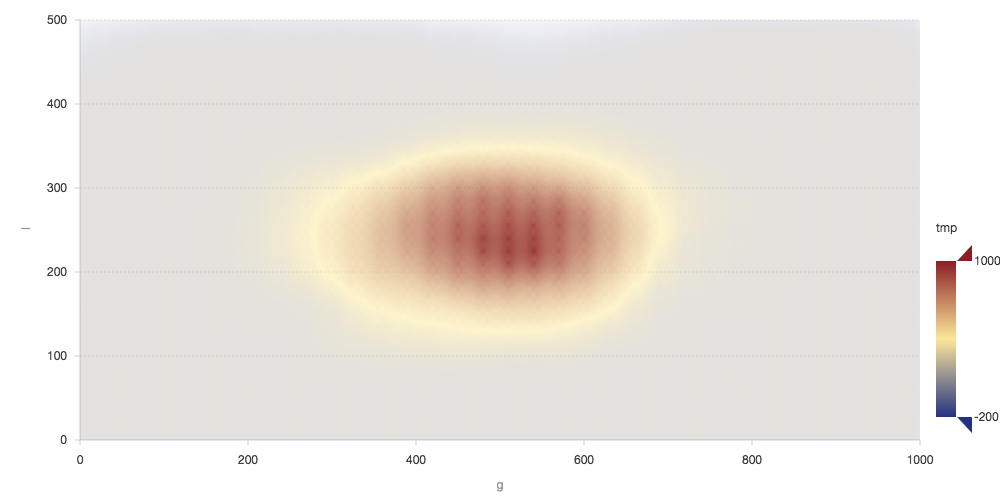
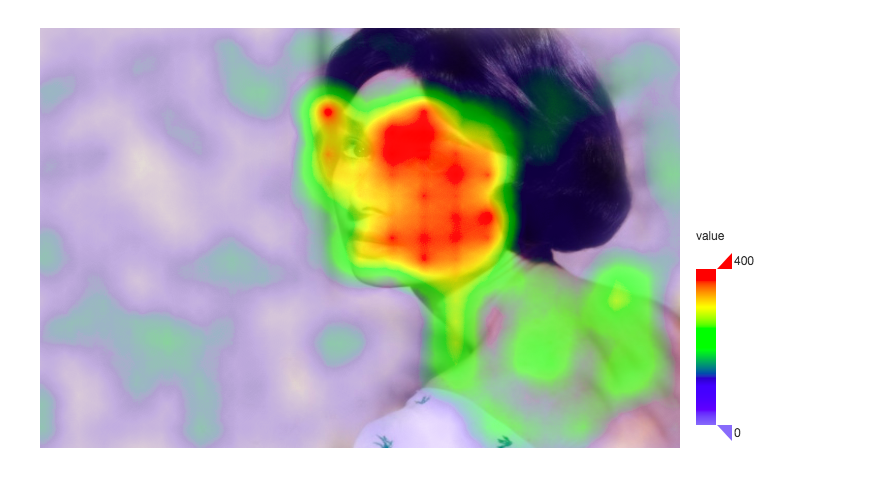
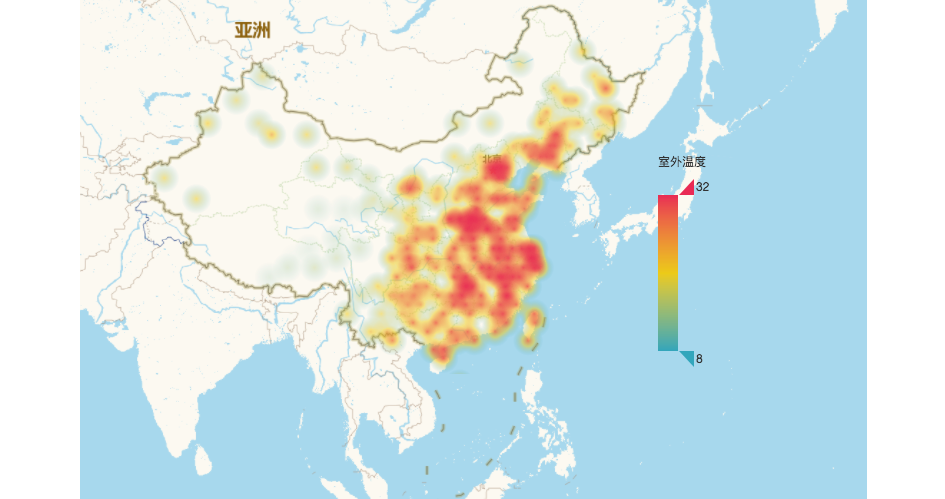
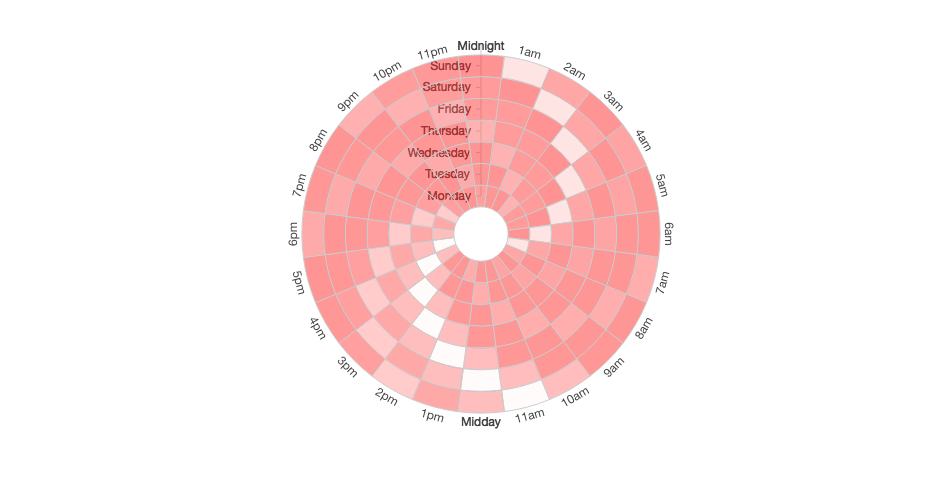
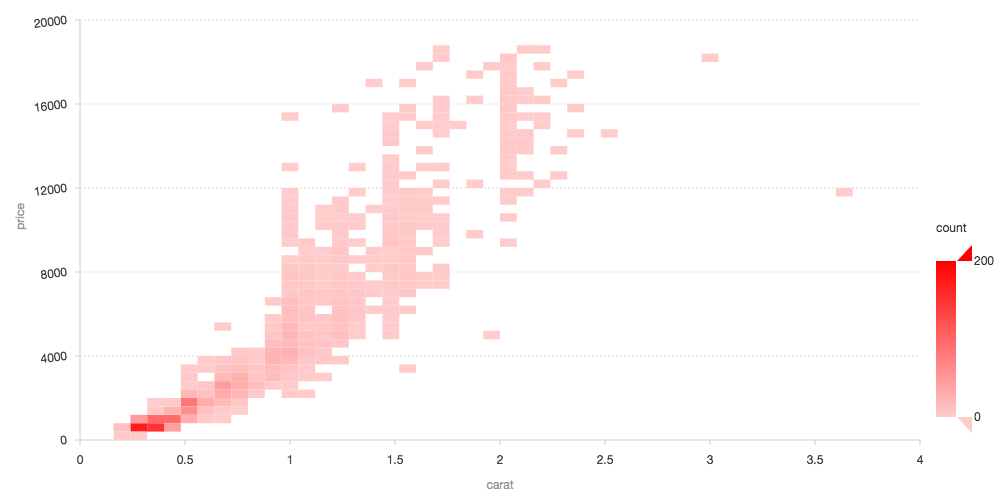
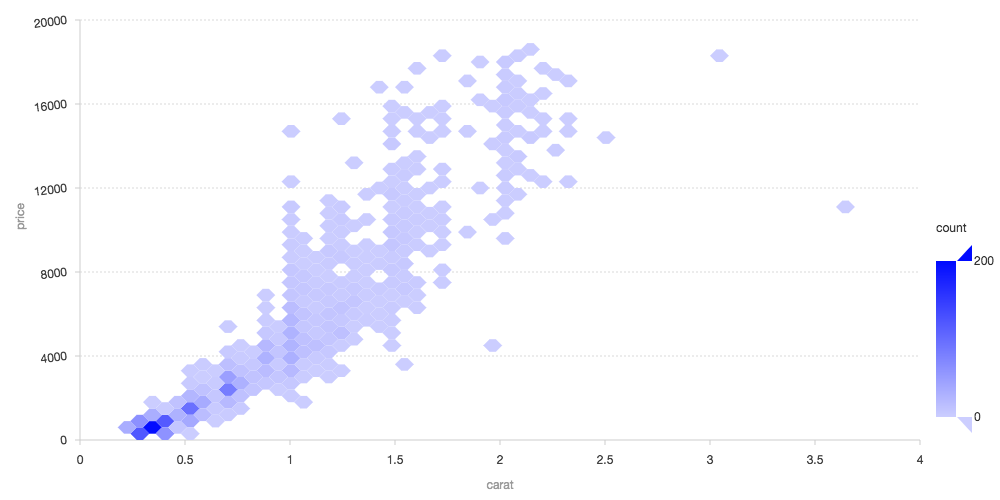
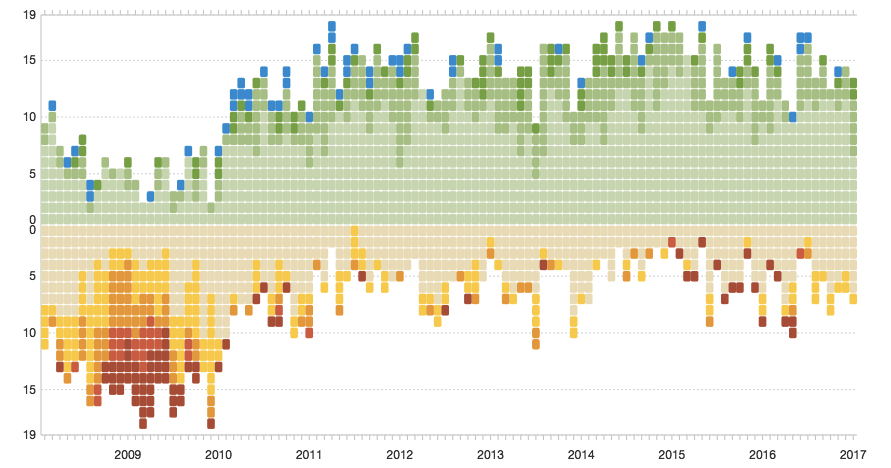
热力或色块图
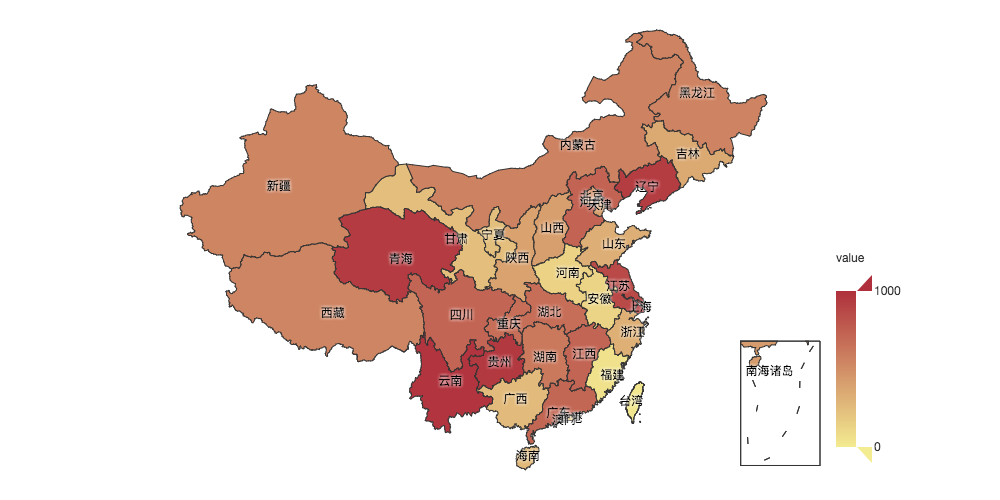
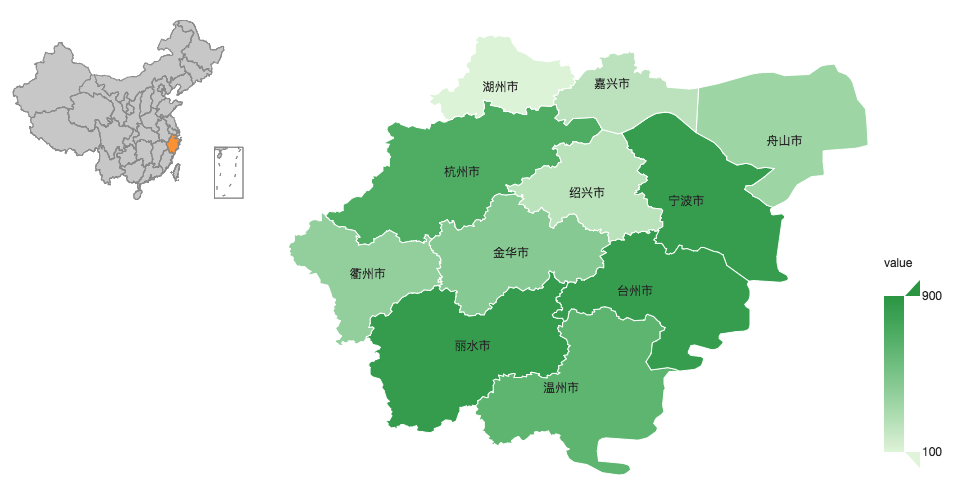
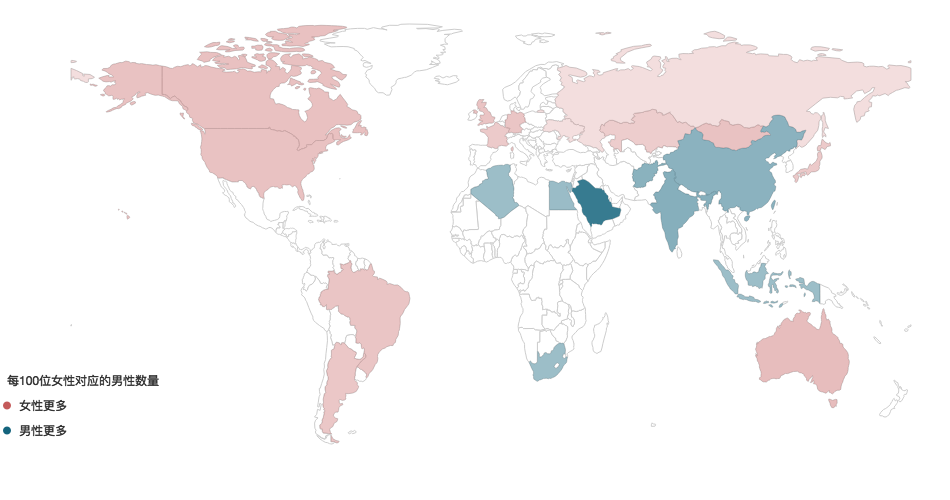
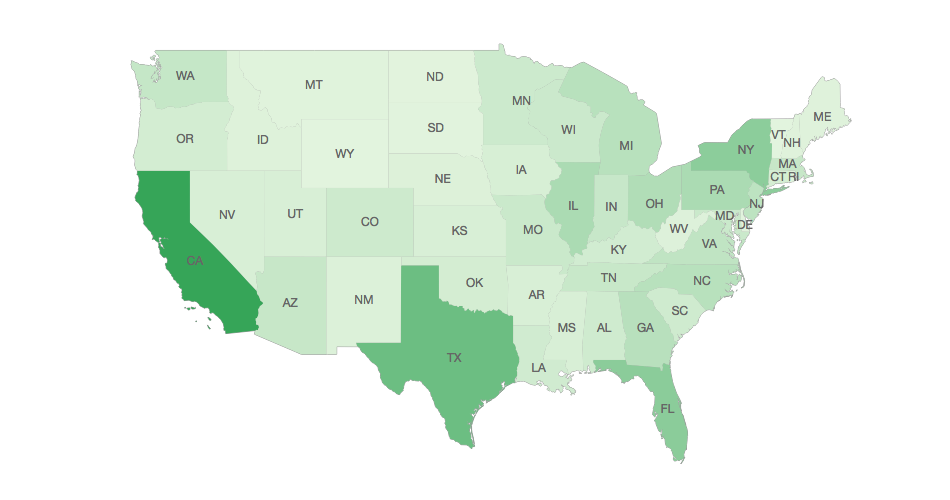
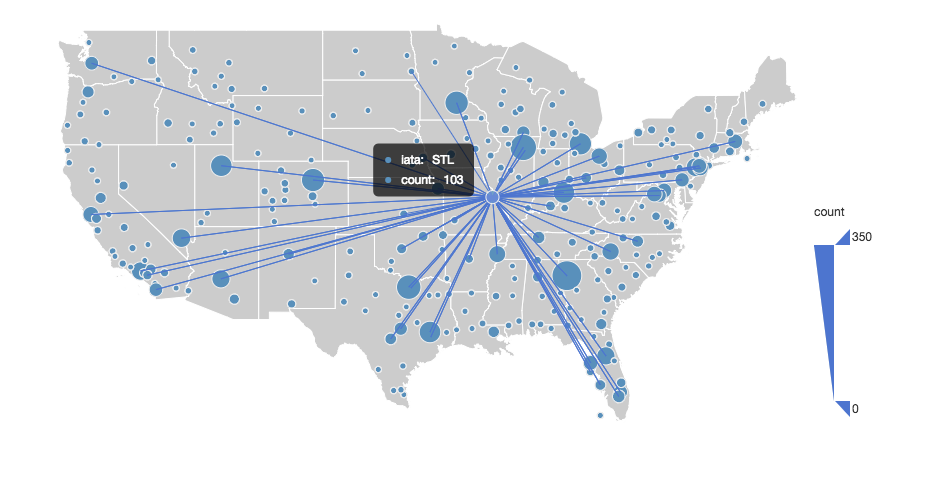
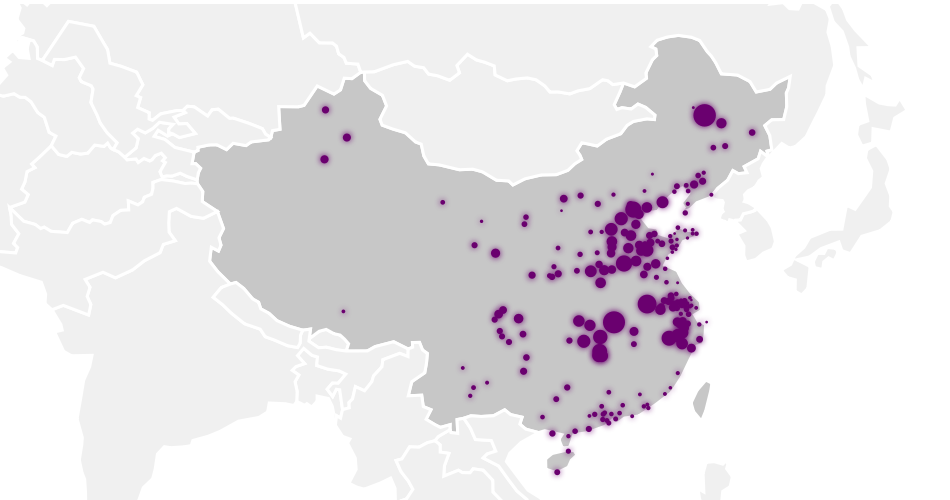
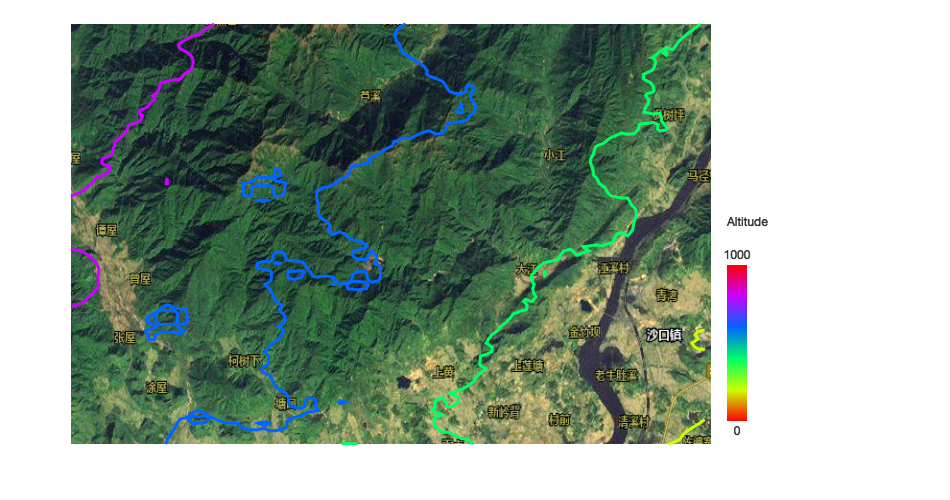
地图
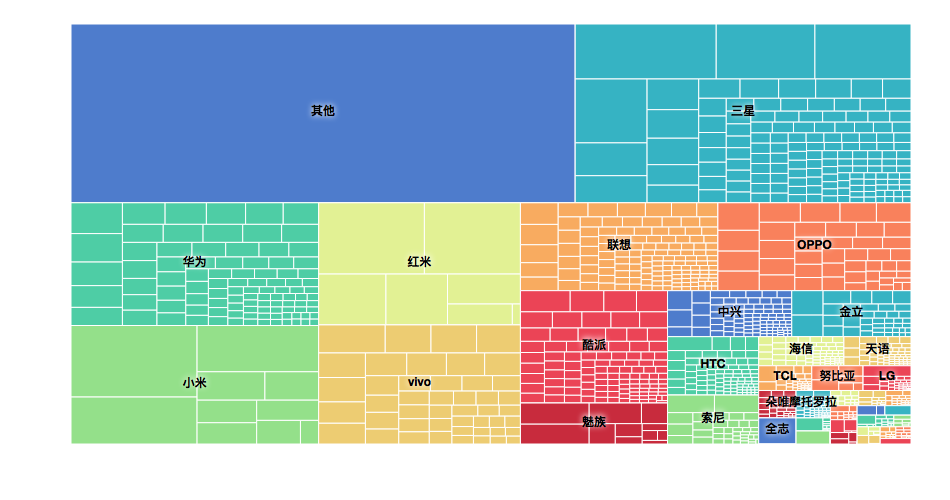
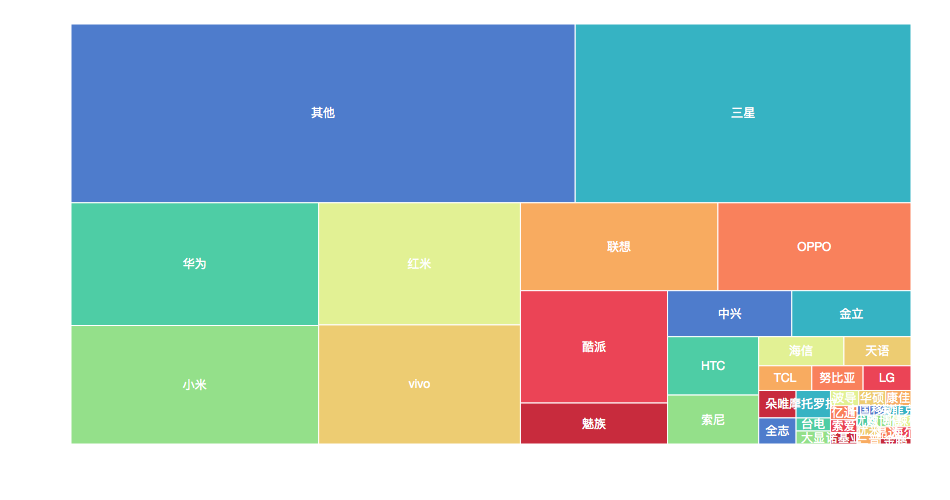
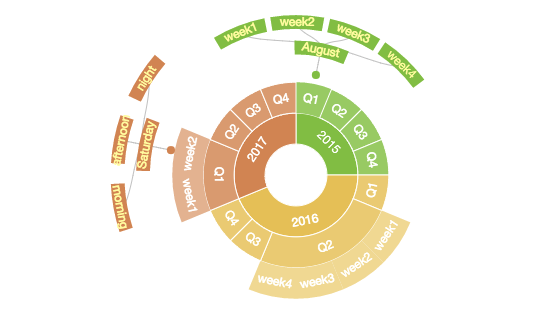
treemap
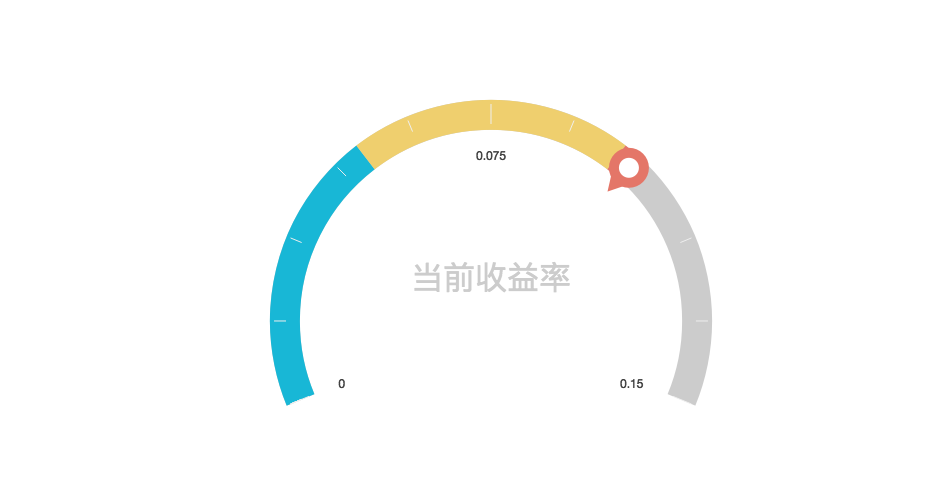
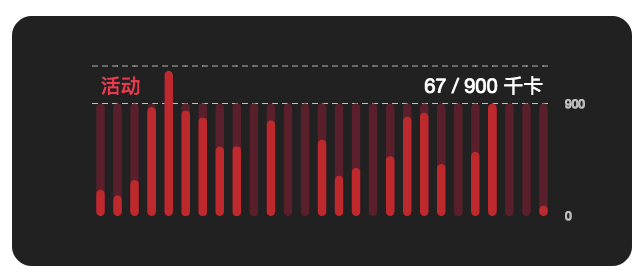
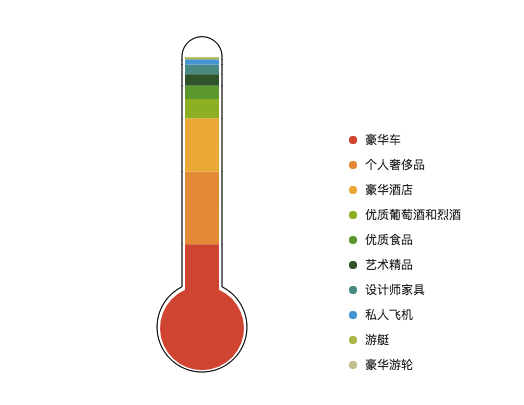
仪表盘
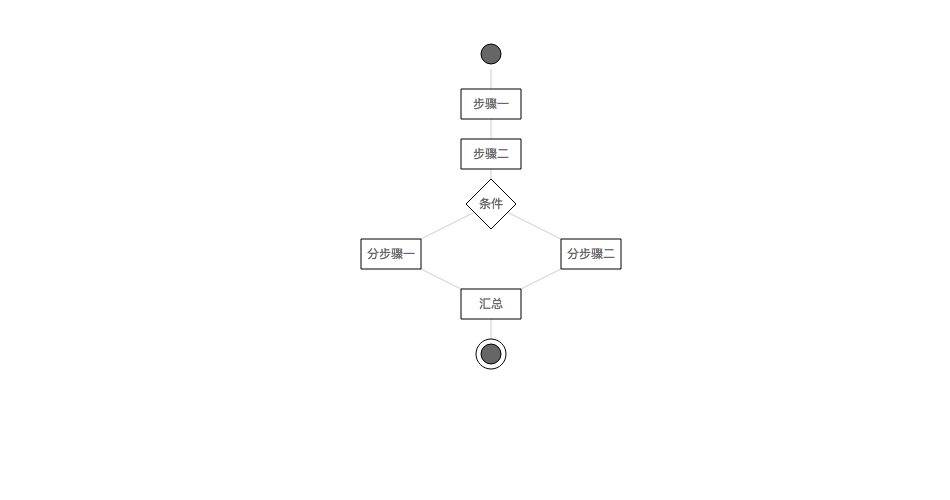
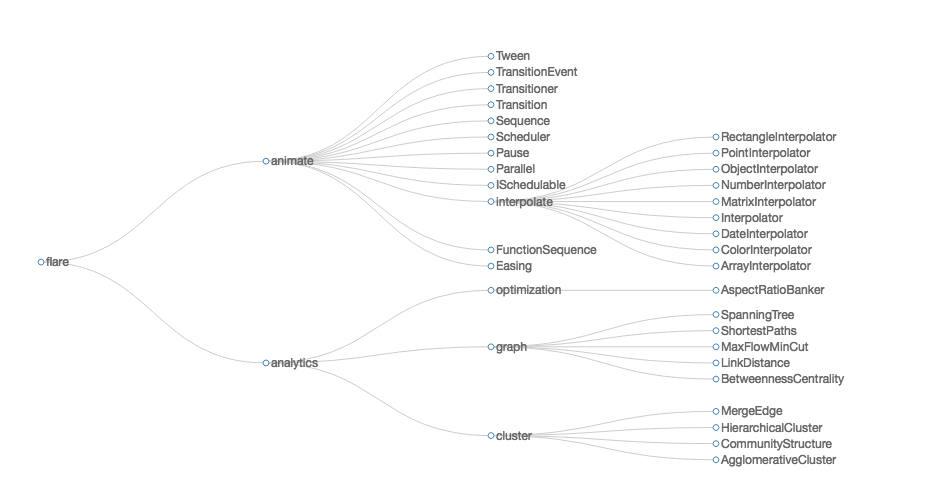
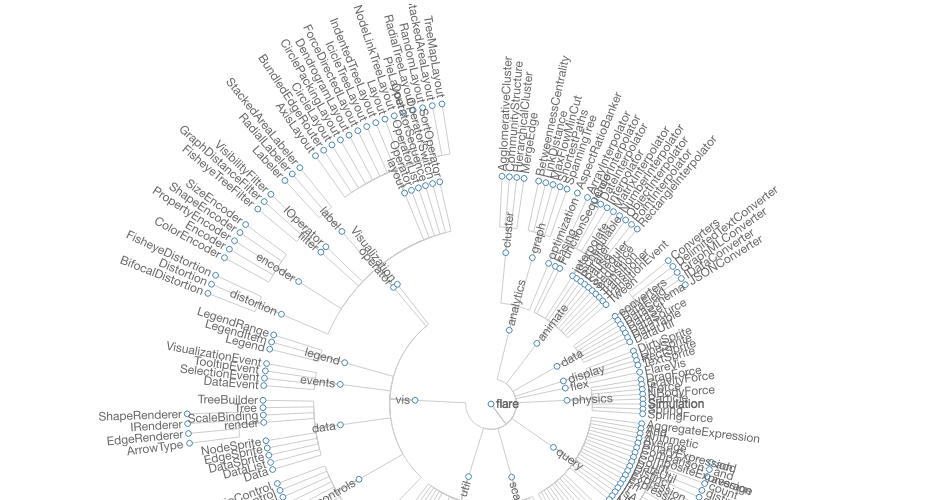
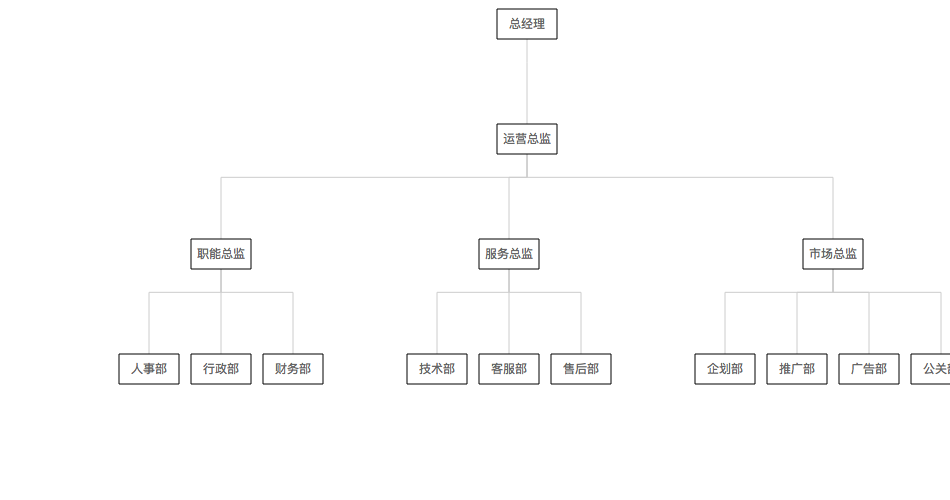
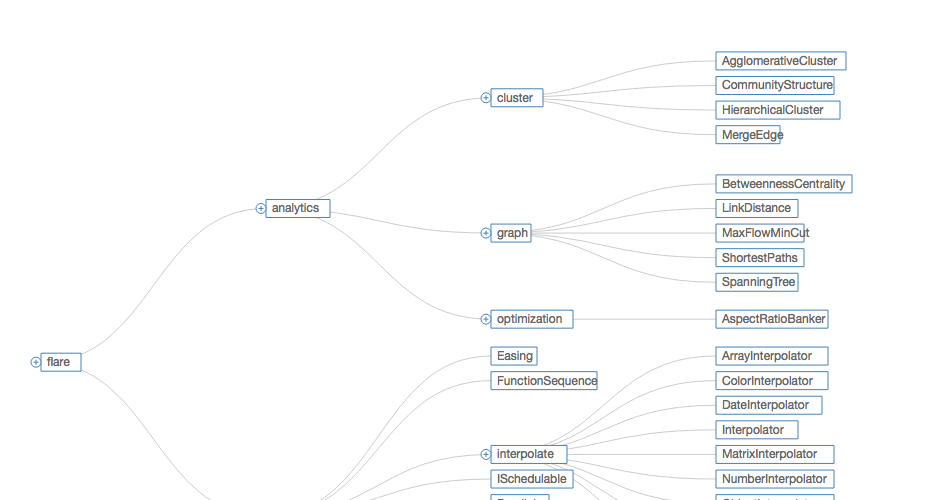
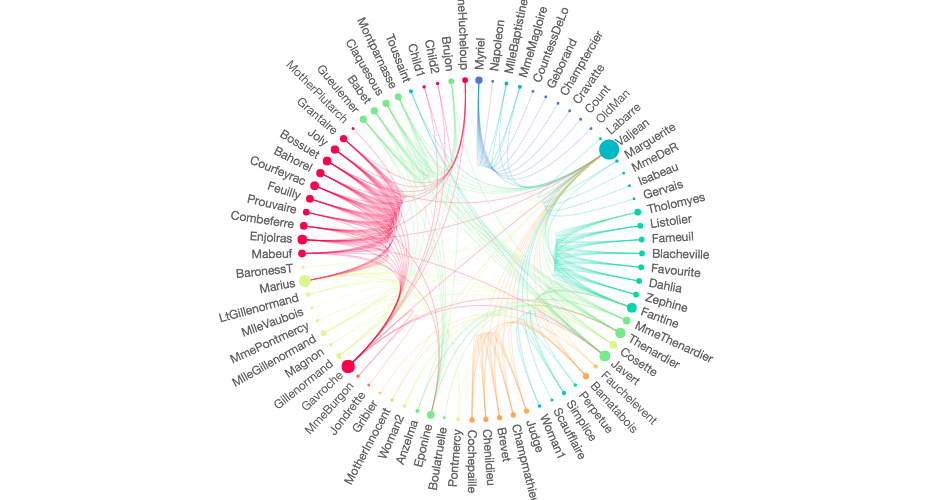
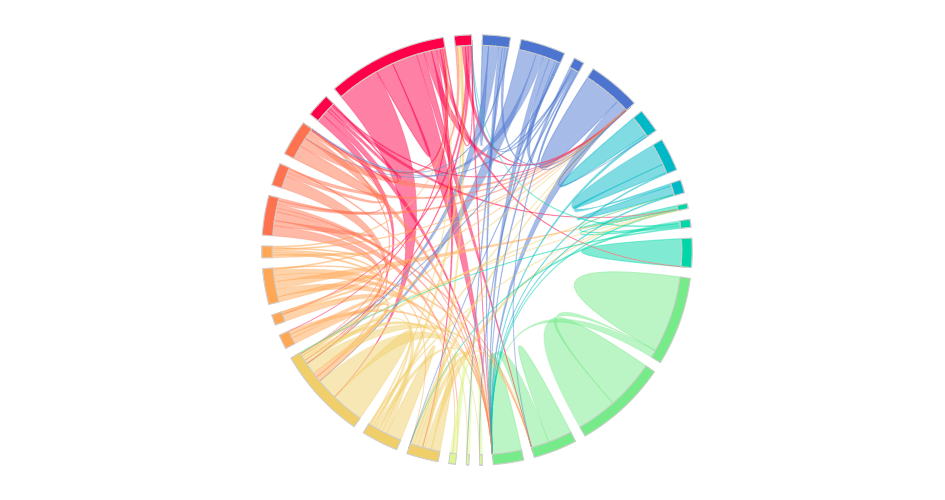
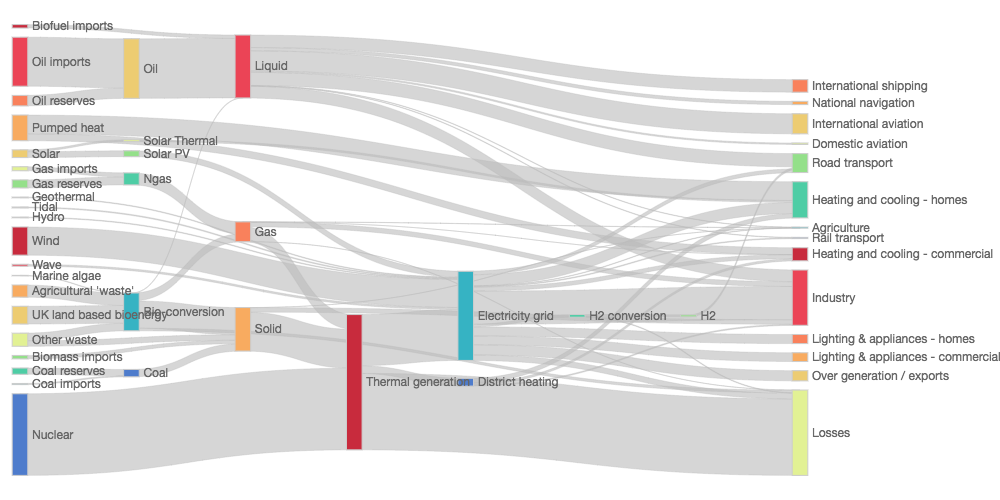
关系图
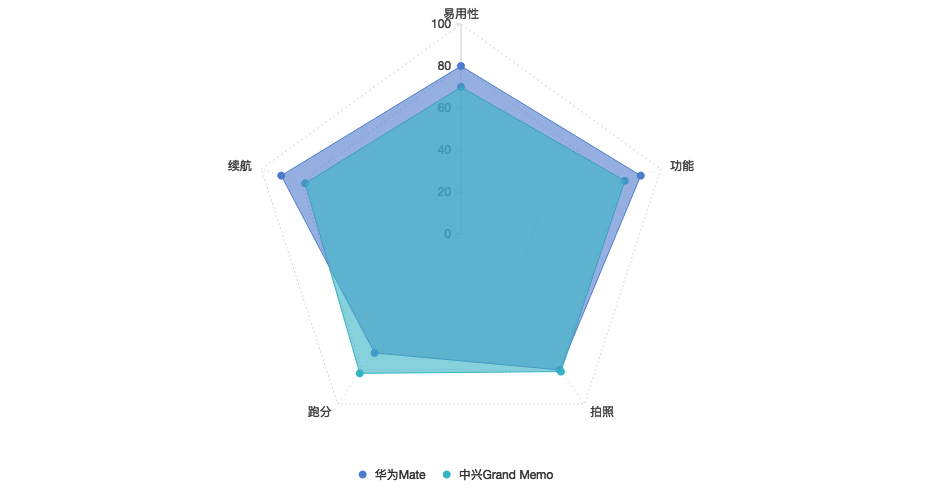
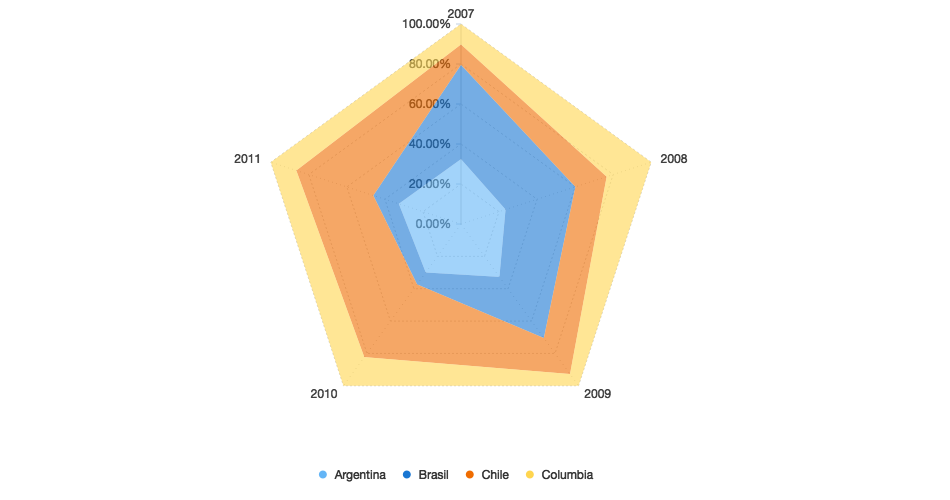
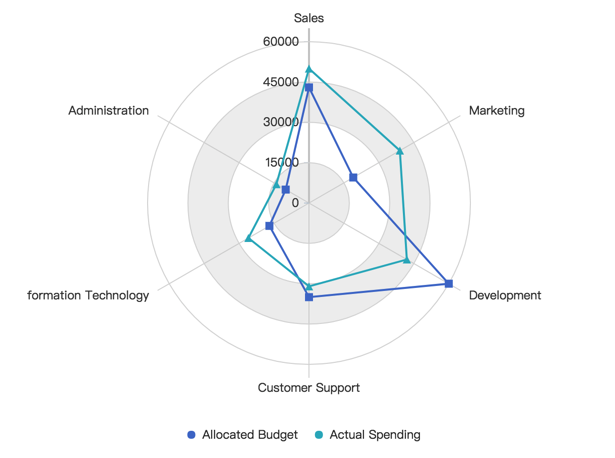
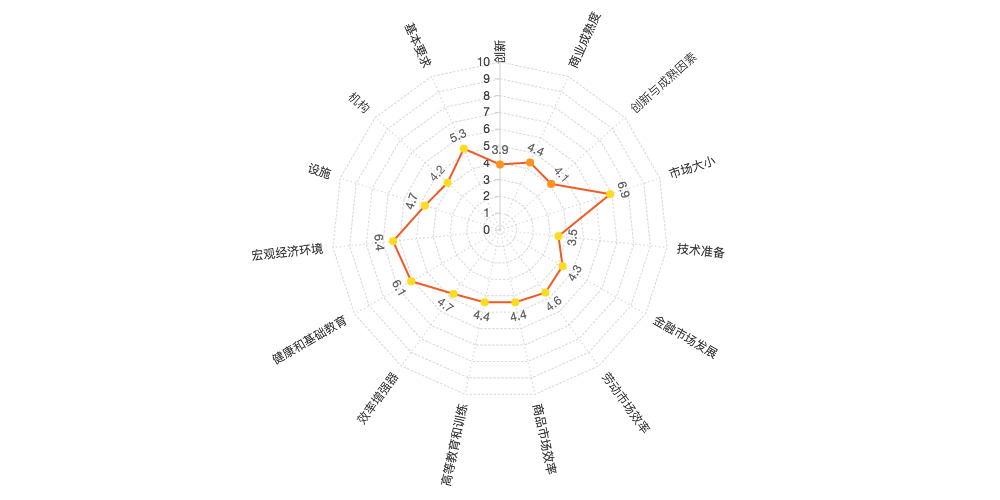
雷达图
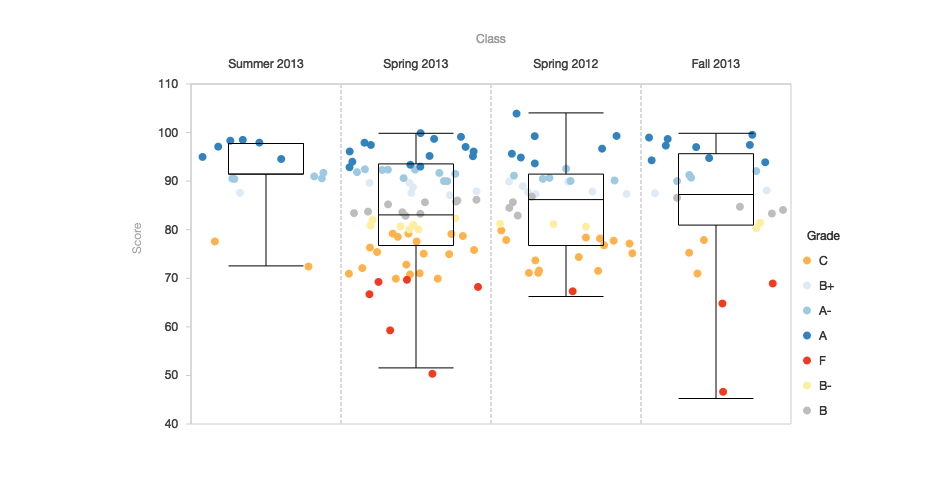
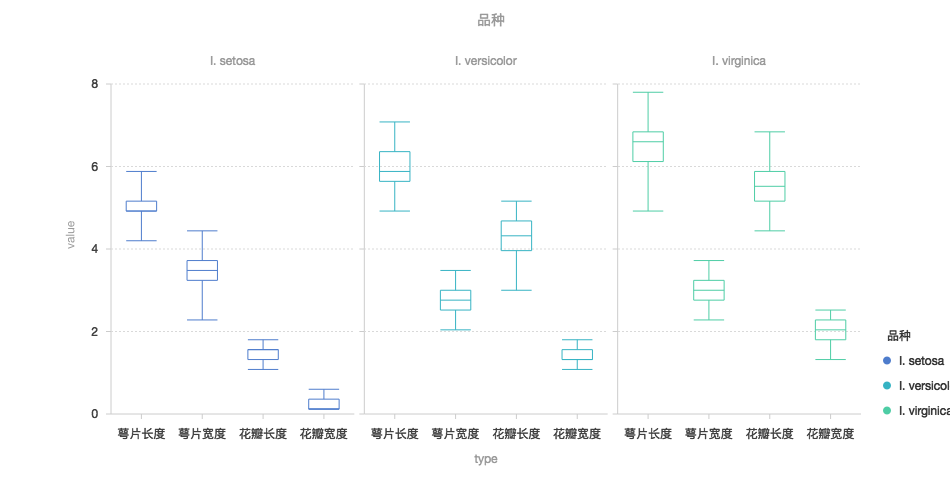
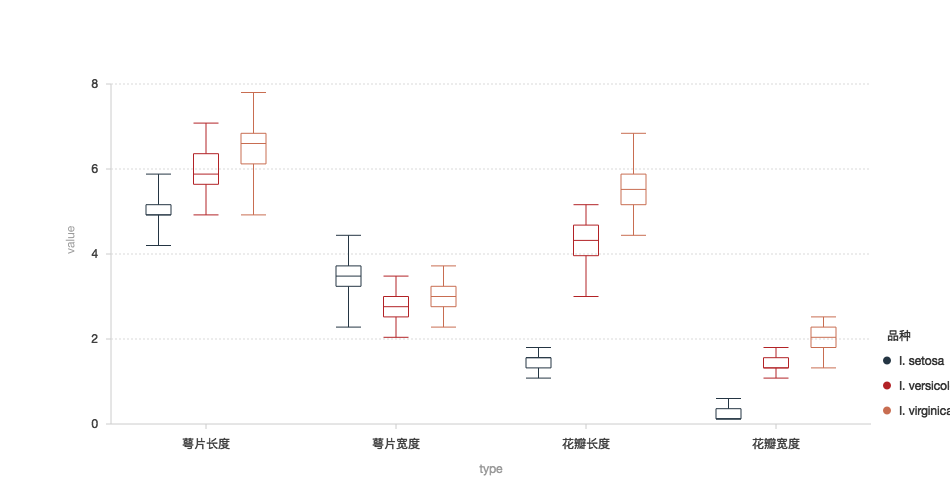
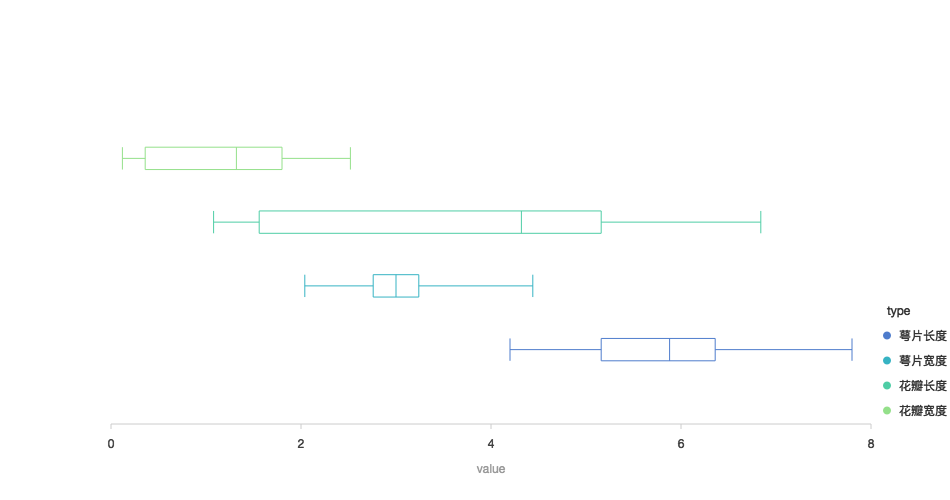
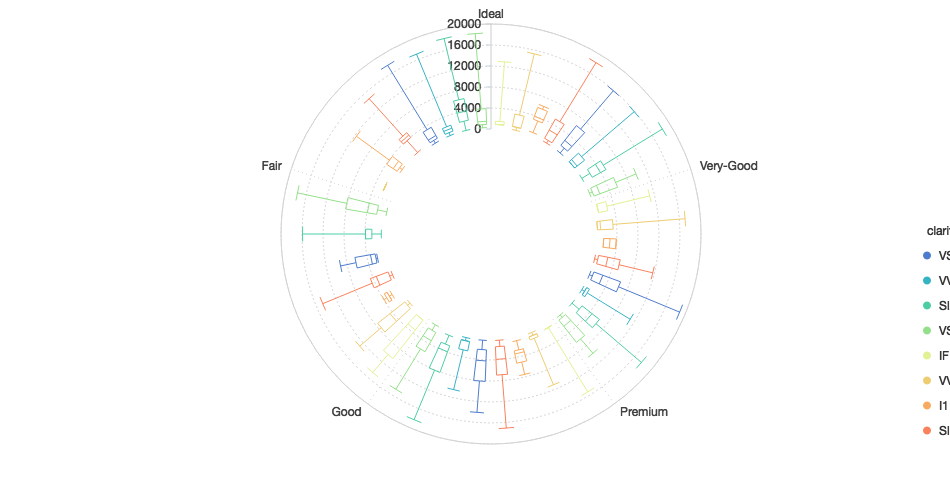
箱型图
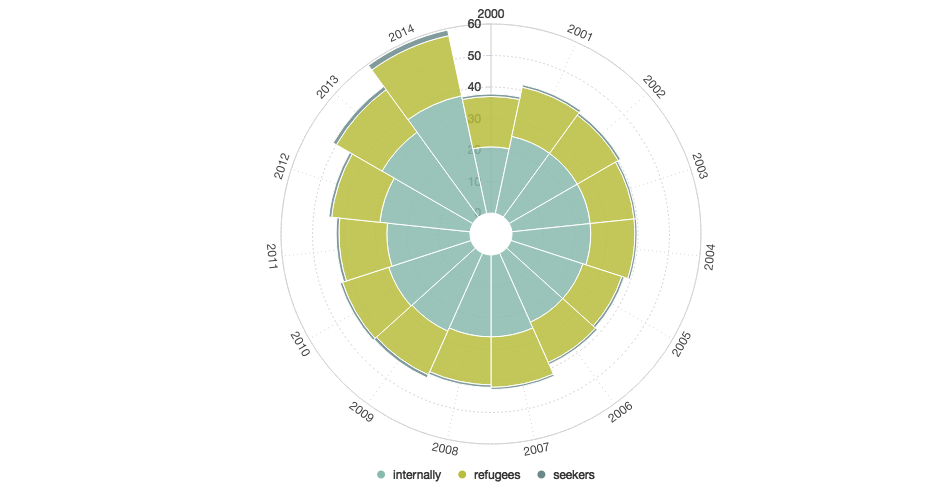
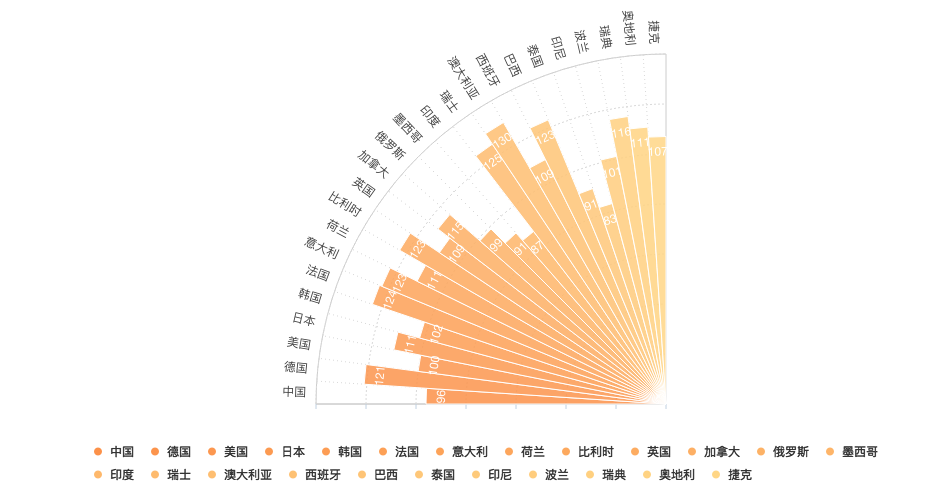
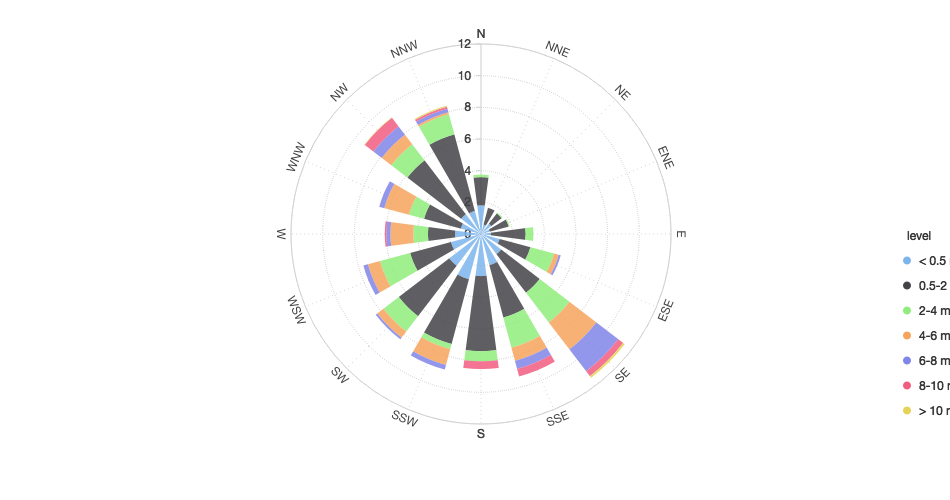
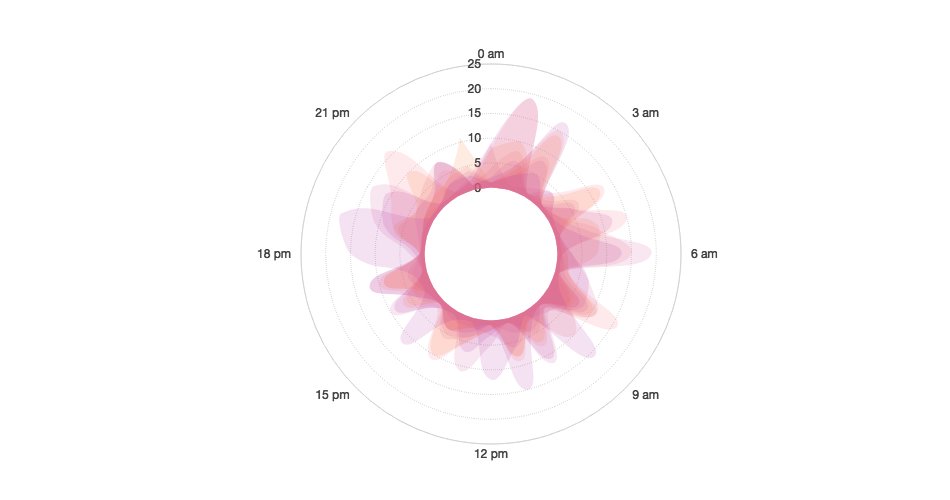
极坐标
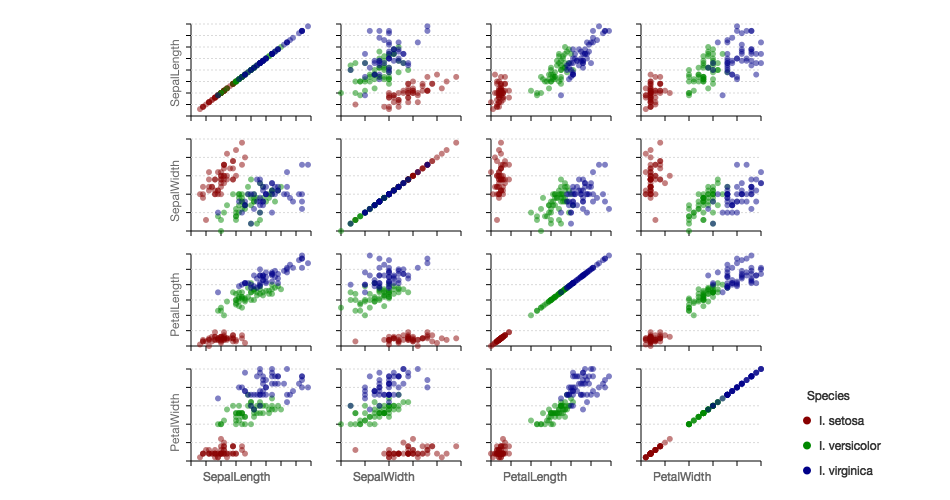
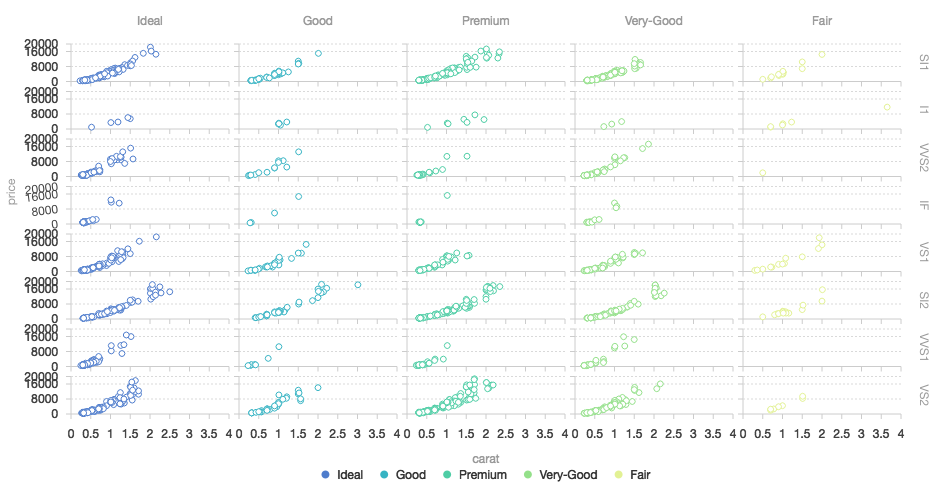
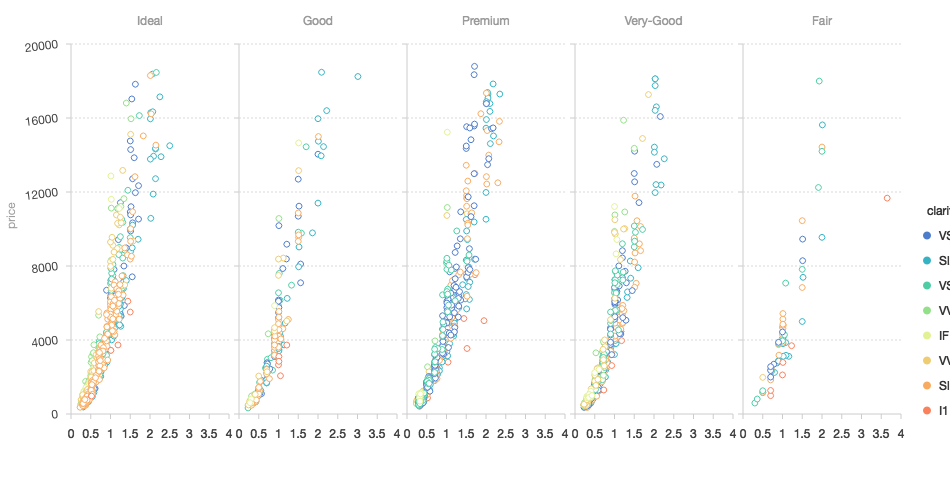
分面
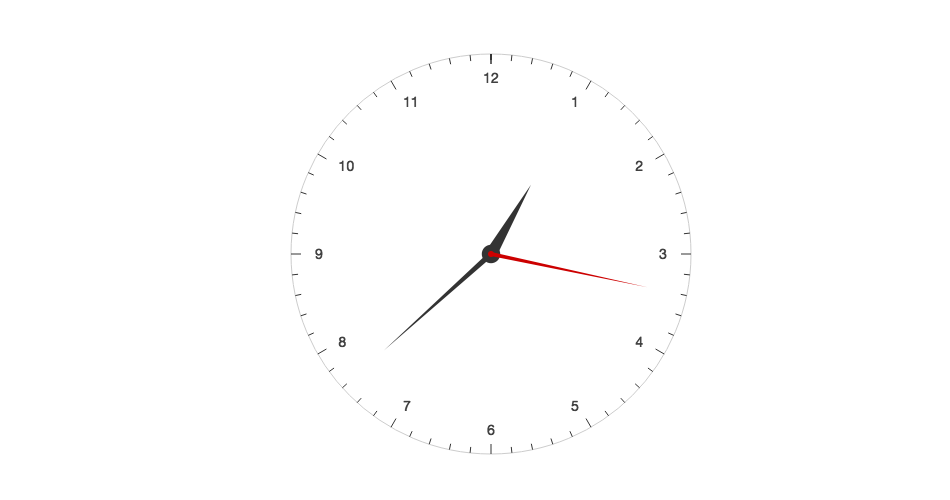
其他图表
gallery
源码
g2-react
运行
复制
<!DOCTYPE html> <html> <head> <meta charset="utf-8"> <title>路径图</title> <script src="https://a.alipayobjects.com/jquery/jquery/1.11.1/jquery.js"></script> <script src="https://gw.alipayobjects.com/as/g/datavis/g2/2.3.13/index.js"></script> </head> <body> <div id="c1"></div> <script> var data = [ {consumption: 0.65, price: 1, year: 1965}, {consumption: 0.66, price: 1.05, year: 1966}, {consumption: 0.64, price: 1.1, year: 1967}, {consumption: 0.63, price: 1.12, year: 1968}, {consumption: 0.55, price: 1.15, year: 1969}, {consumption: 0.57, price: 1.19, year: 1970}, {consumption: 0.58, price: 1.14, year: 1971}, {consumption: 0.59, price: 1, year: 1972}, {consumption: 0.57, price: 0.96, year: 1973}, {consumption: 0.55, price: 0.92, year: 1974}, {consumption: 0.54, price: 0.88, year: 1975}, {consumption: 0.55, price: 0.87, year: 1976}, {consumption: 0.42, price: 0.89, year: 1977}, {consumption: 0.28, price: 1, year: 1978}, {consumption: 0.15, price: 1.1, year: 1979} ]; var chart = new G2.Chart({ id: 'c1', forceFit: true, height: 450 }); chart.source(data); chart.path().position('price*consumption').label('year', function(val) { return val + '年'; }).size(2); chart.point().position('price*consumption').shape('triangle'); chart.render(); </script> </body> </html>
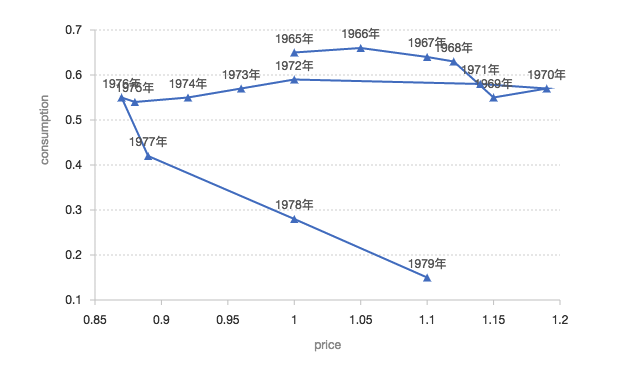
路径图
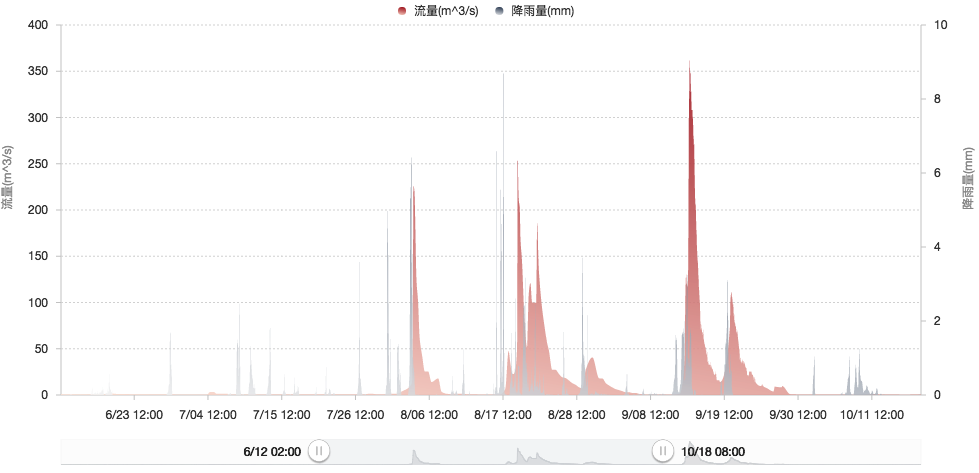
折线图用于显示数据在一个连续的时间间隔或者时间跨度上的变化,它的特点是反映事物随时间或有序类别而变化的趋势。
了解更多
<!DOCTYPE html> <html> <head> <meta charset="utf-8"> <title>路径图</title> <script src="https://unpkg.com/react@15/dist/react.min.js"></script> <script src="https://unpkg.com/react-dom@15/dist/react-dom.min.js"></script> <script src="https://a.alipayobjects.com/g/datavis/g2/2.3.13/g2.js"></script> <script src="https://unpkg.com/g2-react@1.2.0/dist/index.js"></script> <script src="https://cdn.bootcss.com/babel-core/5.8.38/browser.min.js"></script> <script src="https://unpkg.com/axios/dist/axios.min.js"></script> </head> <body> <div id="c1"></div> <script type="text/babel"> const Chart = createG2(chart => { chart.path().position('price*consumption').label('year', function(val) { return val + '年'; }).size(2); chart.point().position('price*consumption').shape('triangle'); chart.render(); }); const MyComponent = React.createClass({ getInitialState() { return { data: [ {consumption: 0.65, price: 1, year: 1965}, {consumption: 0.66, price: 1.05, year: 1966}, {consumption: 0.64, price: 1.1, year: 1967}, {consumption: 0.63, price: 1.12, year: 1968}, {consumption: 0.55, price: 1.15, year: 1969}, {consumption: 0.57, price: 1.19, year: 1970}, {consumption: 0.58, price: 1.14, year: 1971}, {consumption: 0.59, price: 1, year: 1972}, {consumption: 0.57, price: 0.96, year: 1973}, {consumption: 0.55, price: 0.92, year: 1974}, {consumption: 0.54, price: 0.88, year: 1975}, {consumption: 0.55, price: 0.87, year: 1976}, {consumption: 0.42, price: 0.89, year: 1977}, {consumption: 0.28, price: 1, year: 1978}, {consumption: 0.15, price: 1.1, year: 1979} ], forceFit: true, width: 500, height: 450, }; }, render() { return ( <div> <Chart data={this.state.data} width={this.state.width} height={this.state.height} forceFit={this.state.forceFit} /> </div> ); }, }); ReactDOM.render(<MyComponent />, document.getElementById('c1')); </script> </body> </html>