G2
图表示例
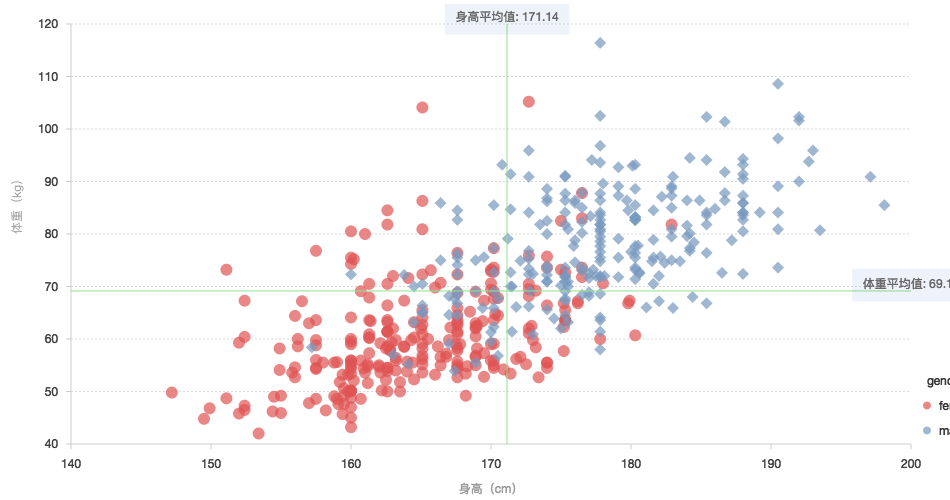
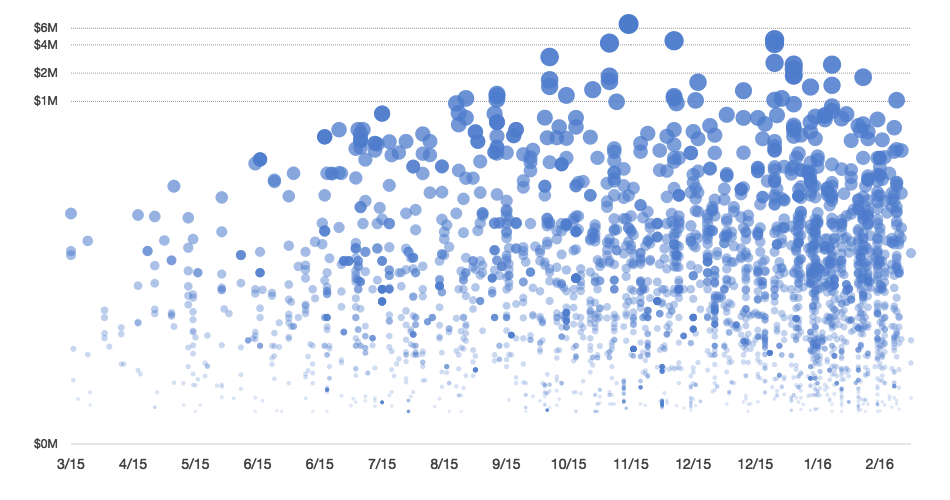
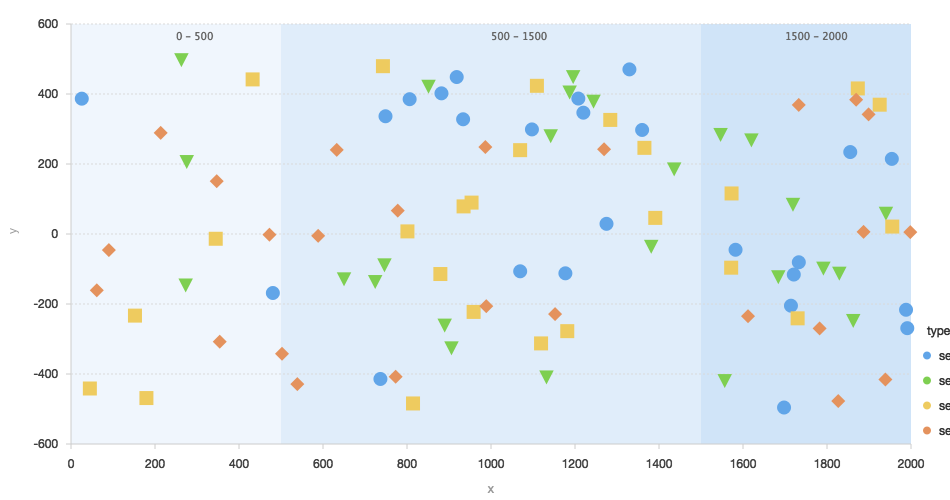
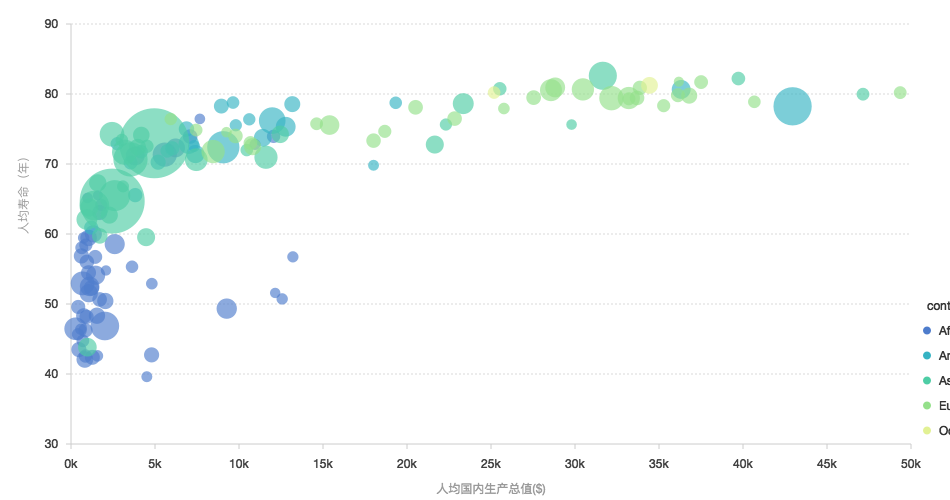
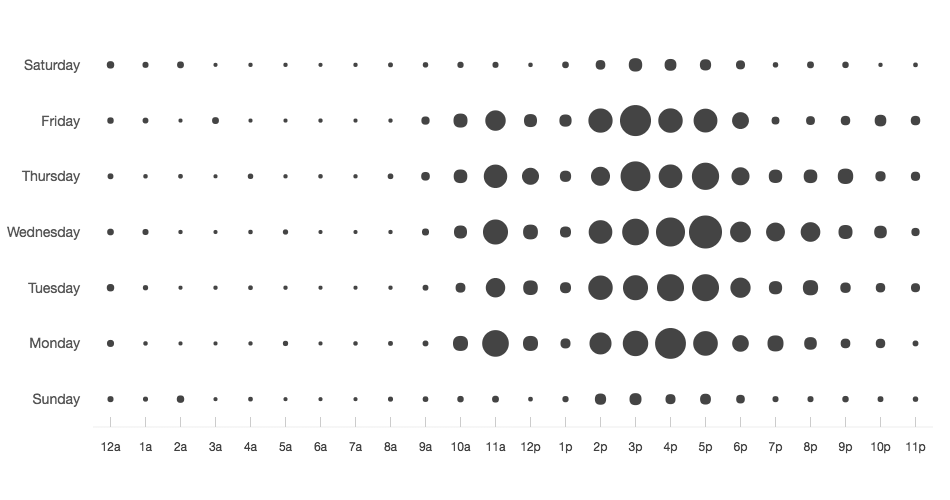
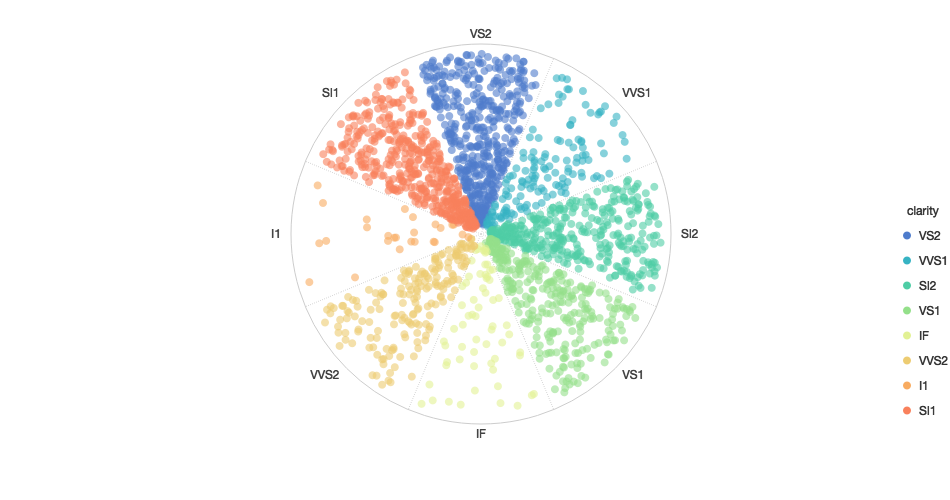
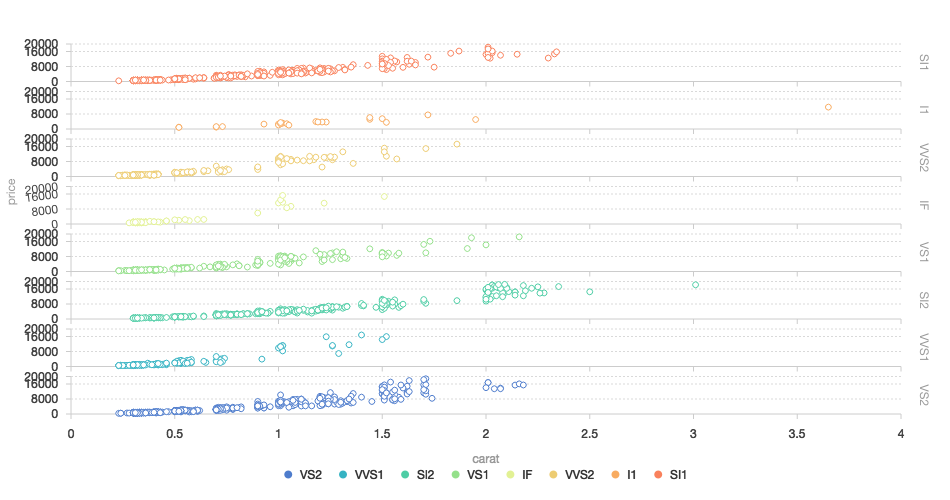
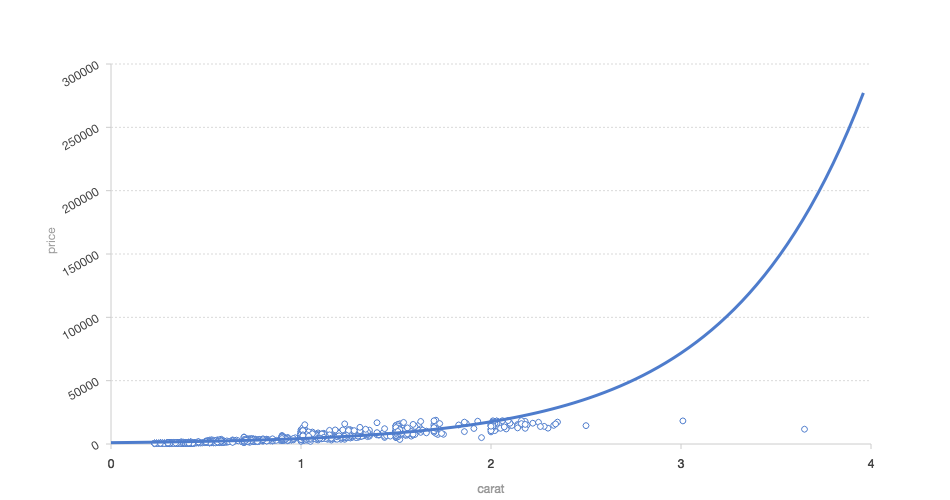
点图
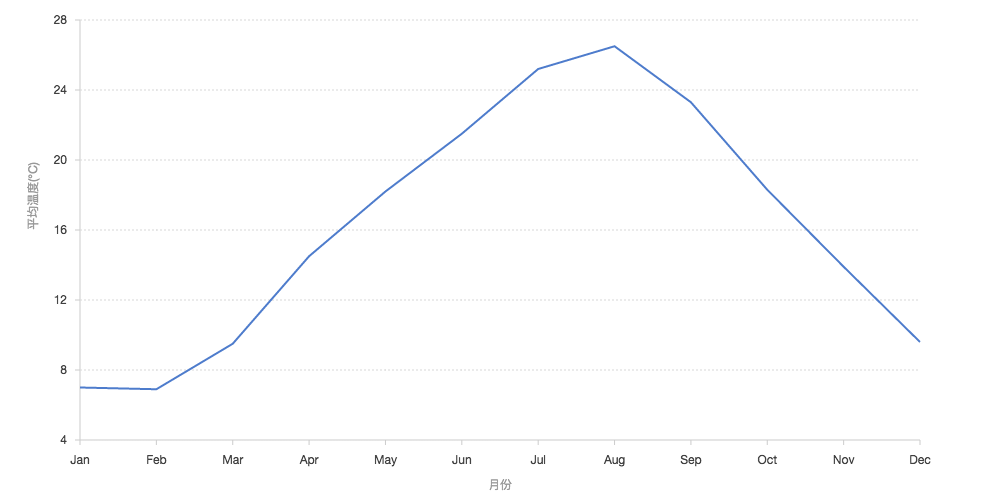
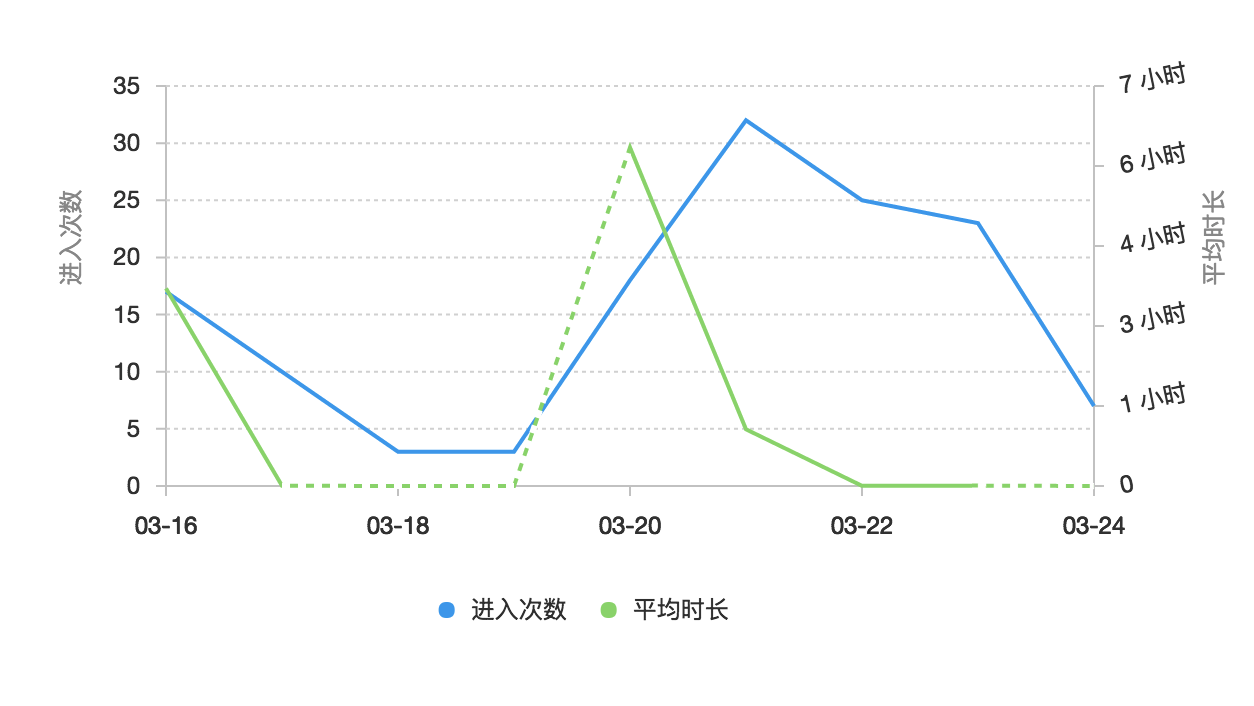
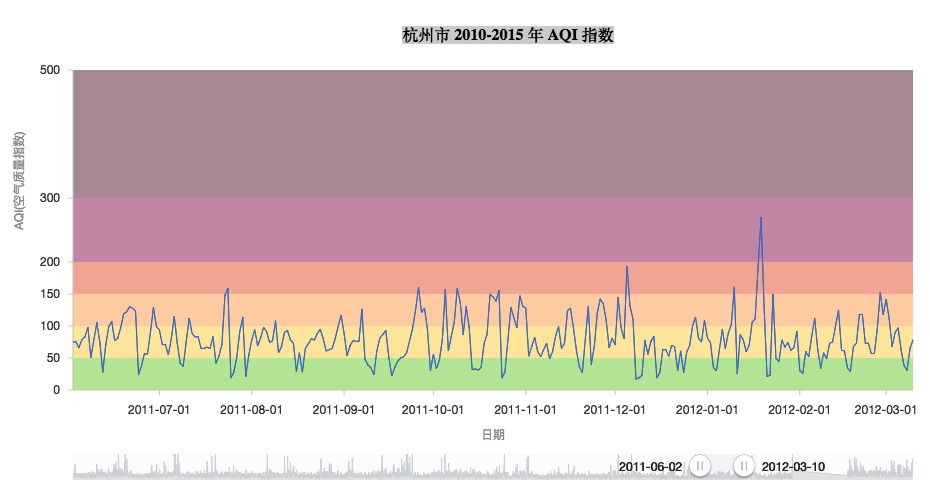
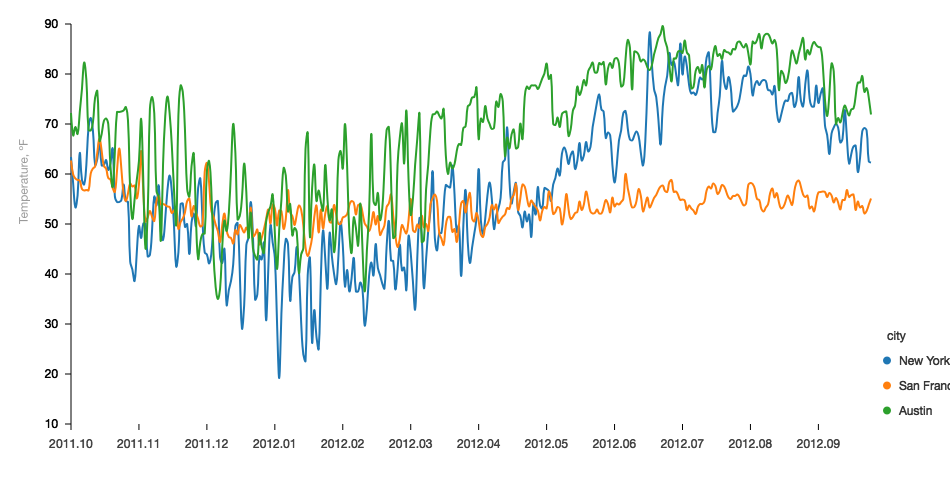
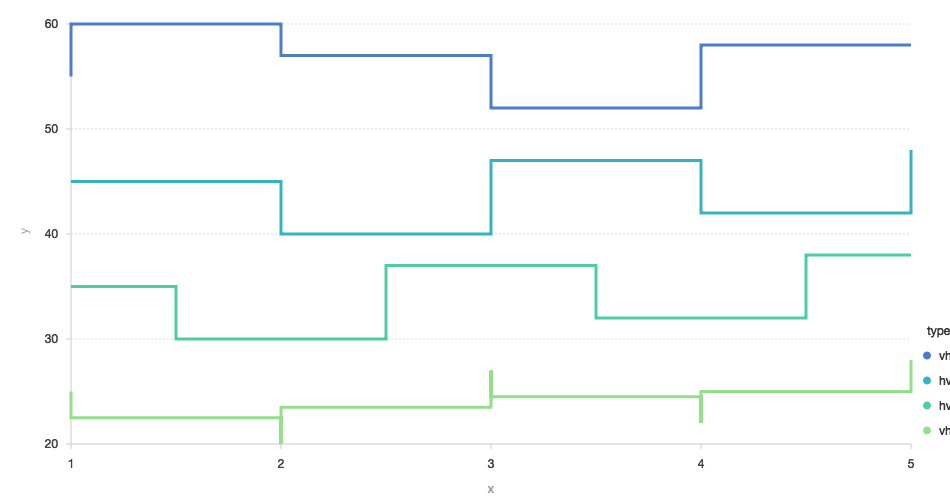
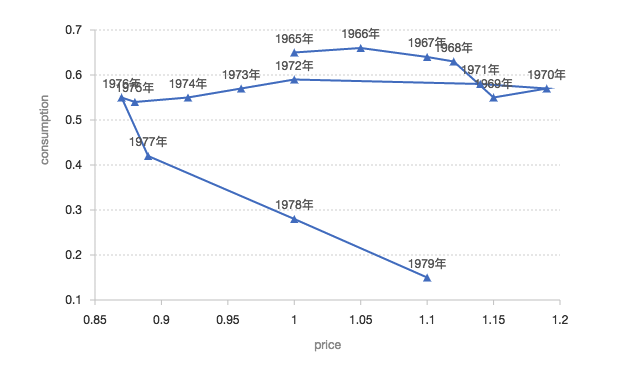
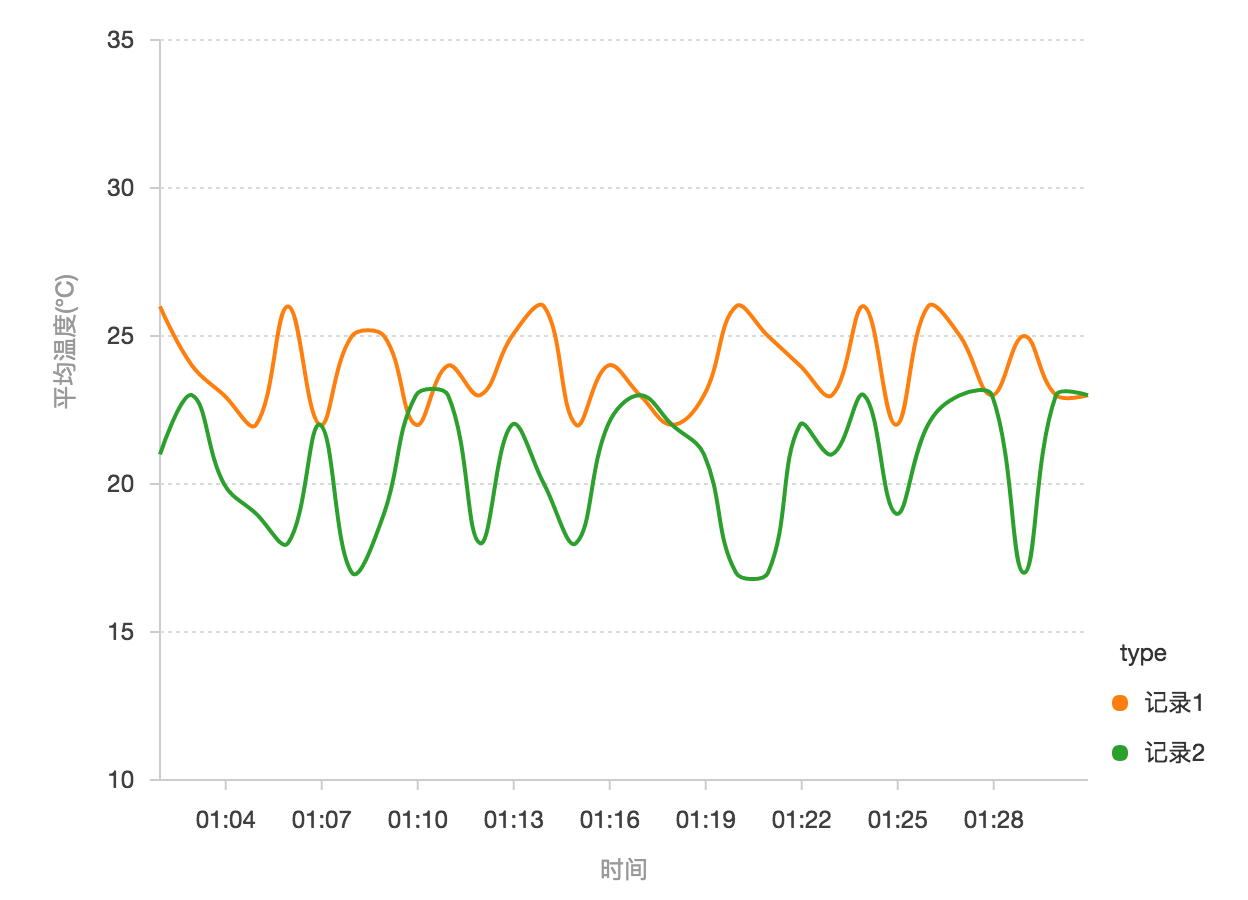
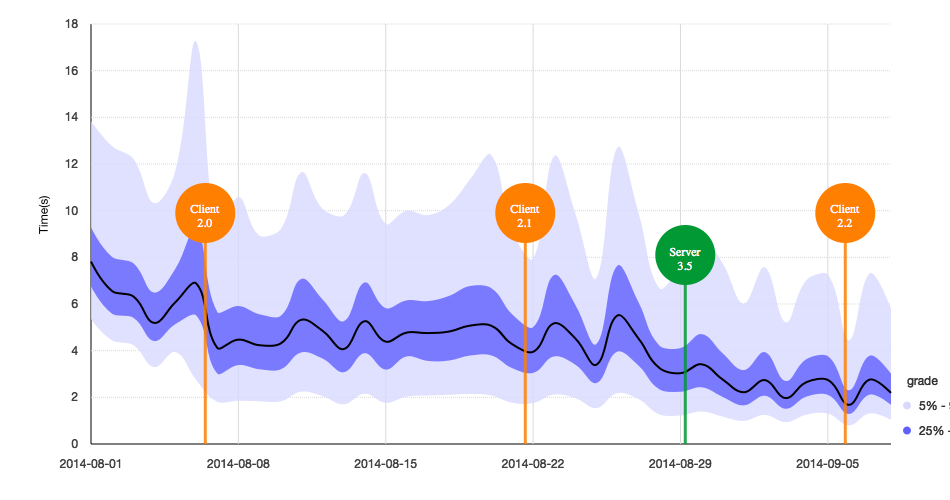
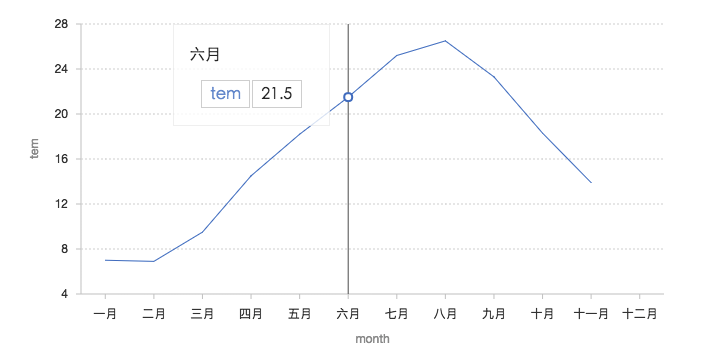
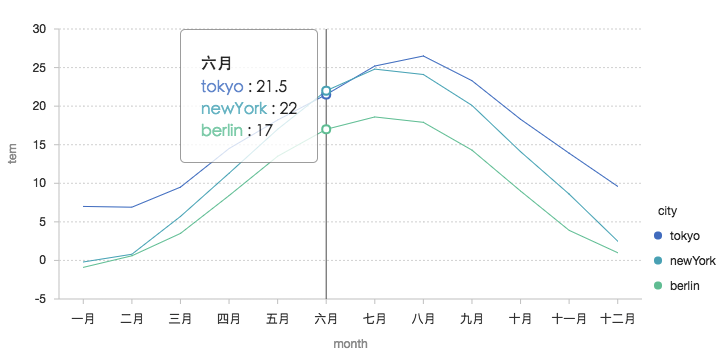
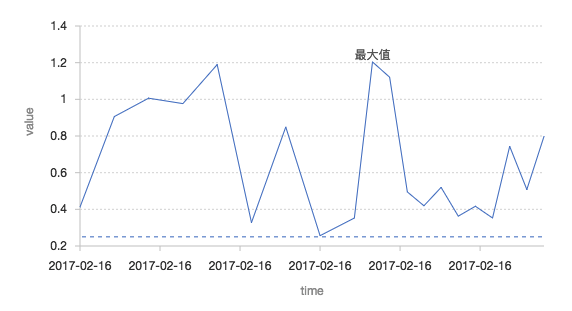
线图
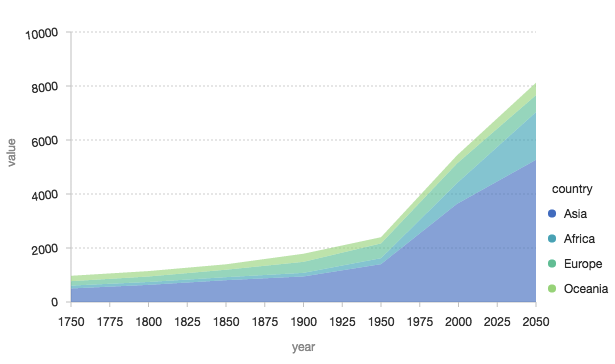
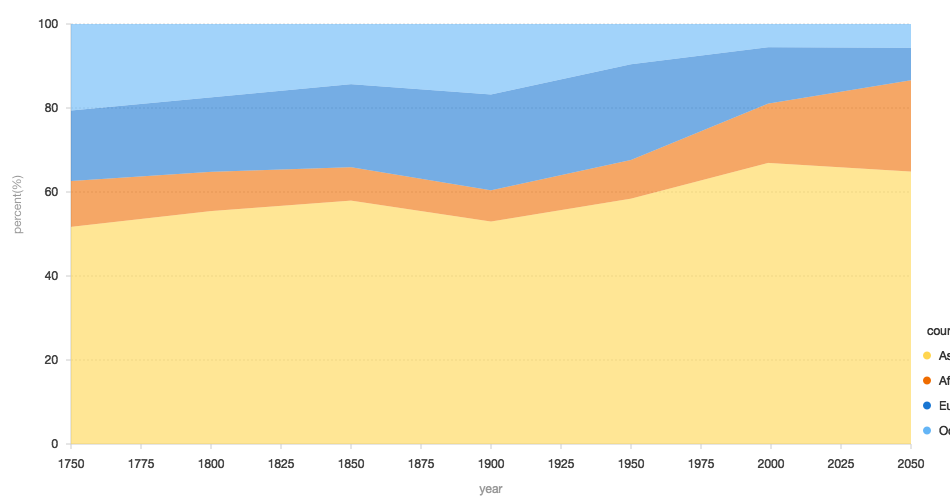
区域图
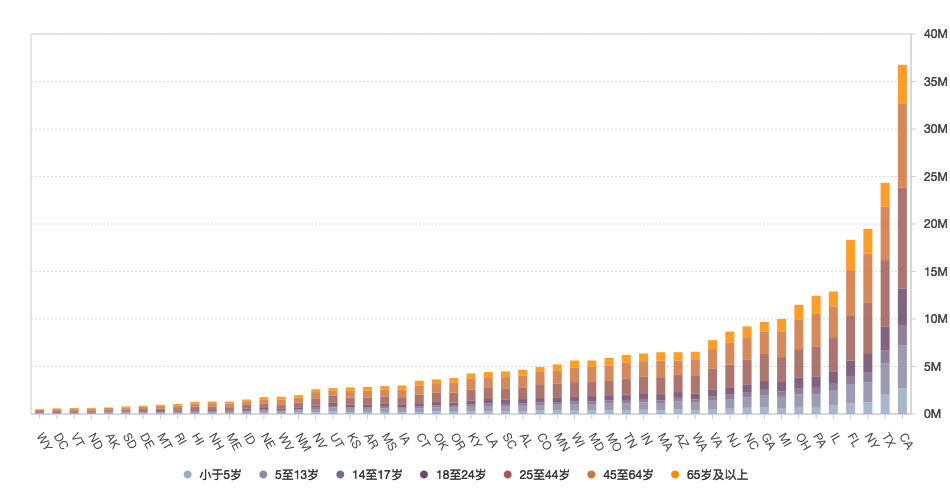
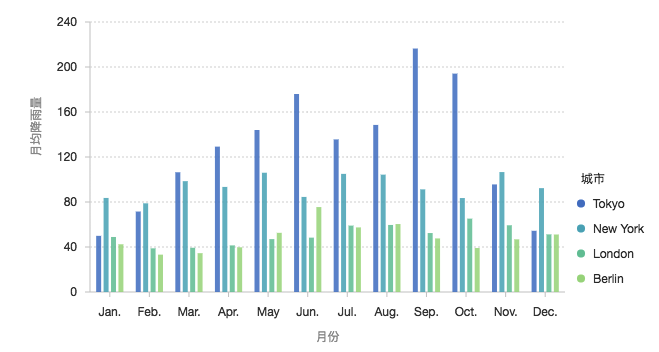
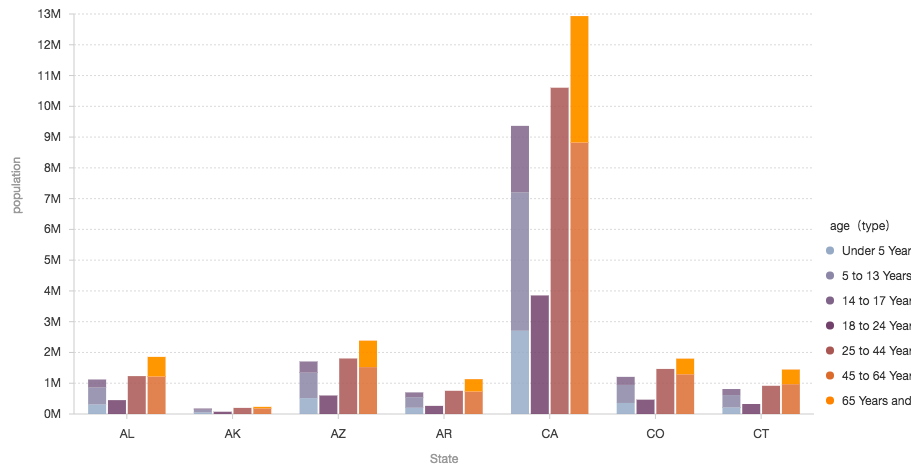
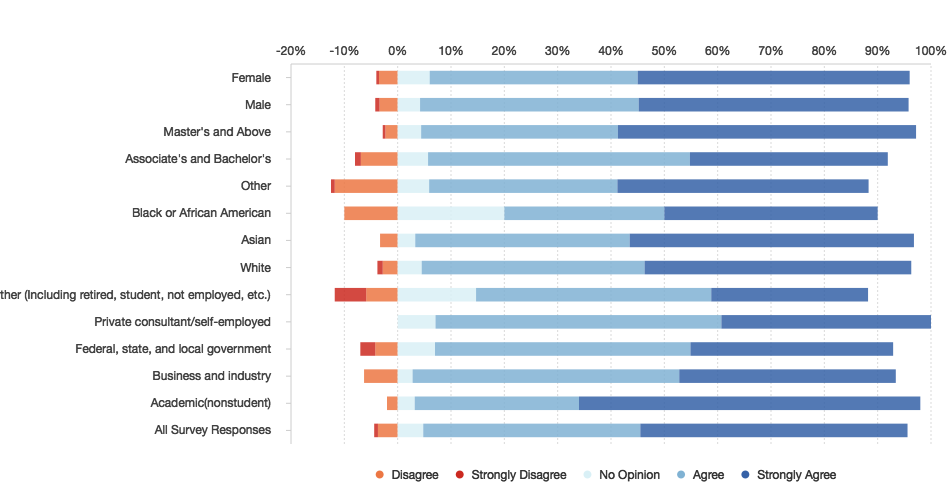
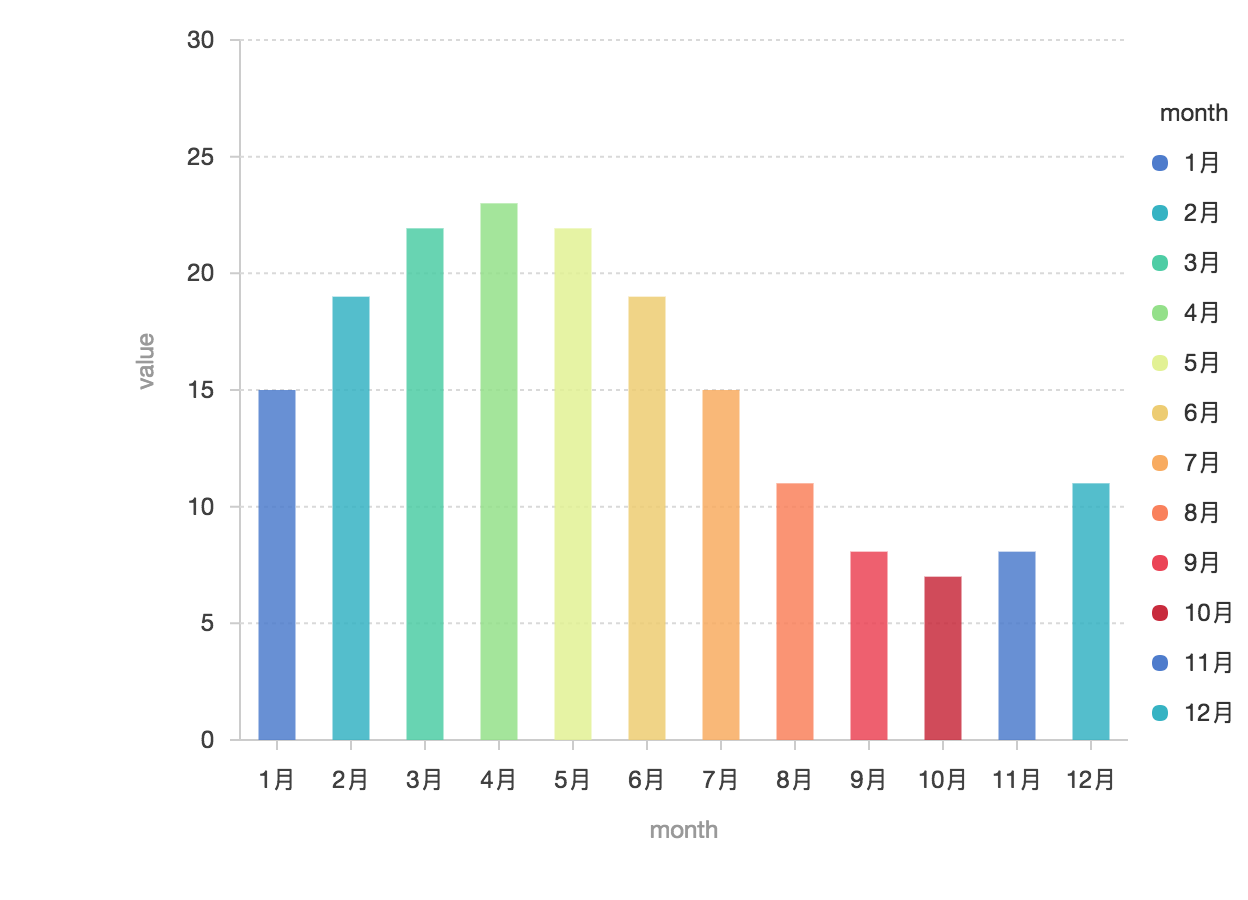
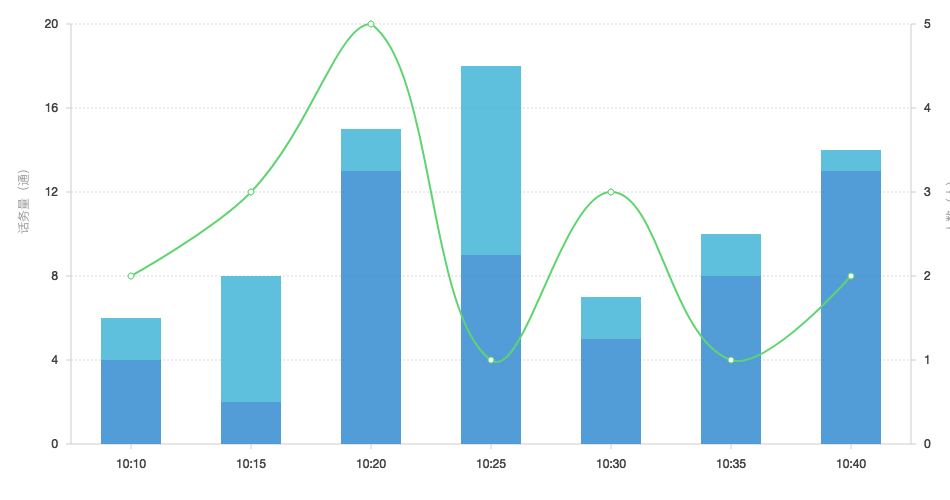
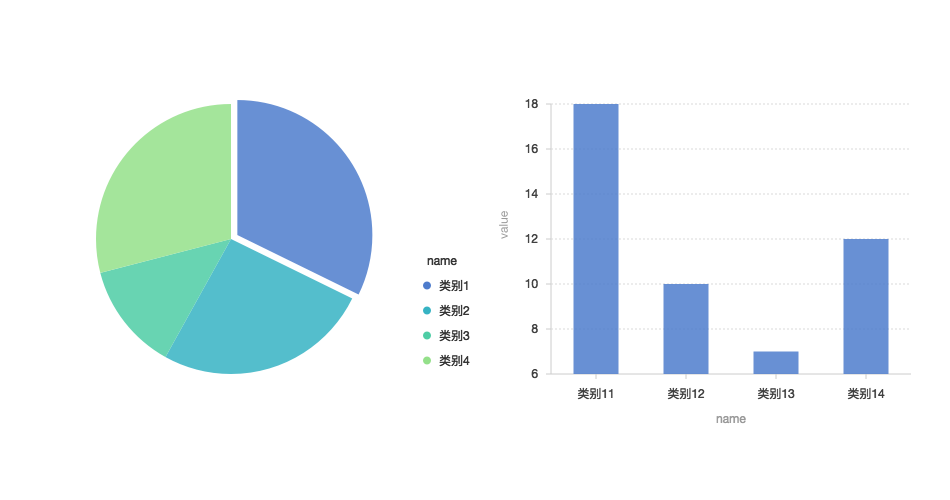
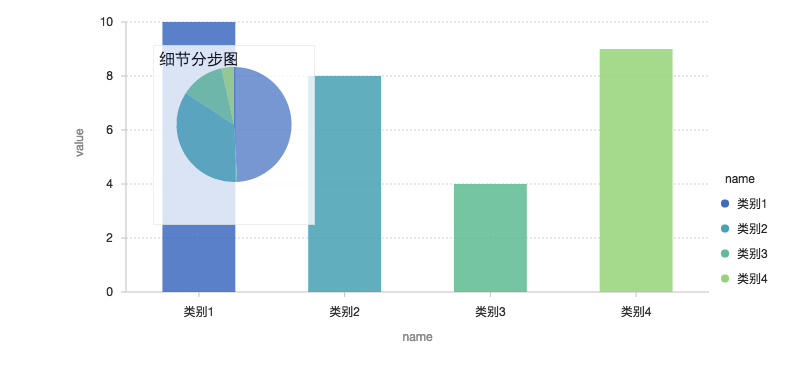
柱状图
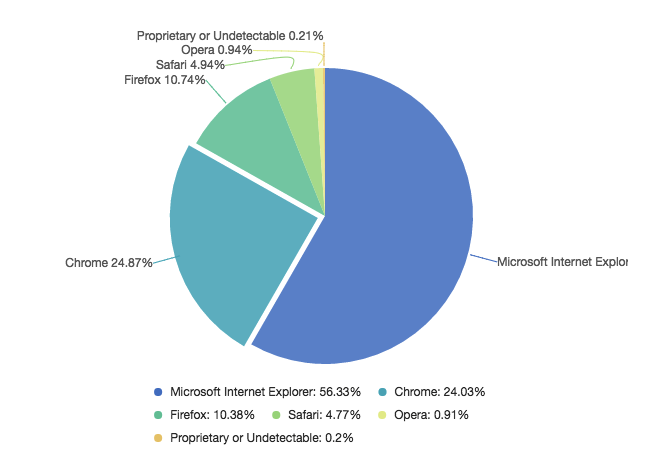
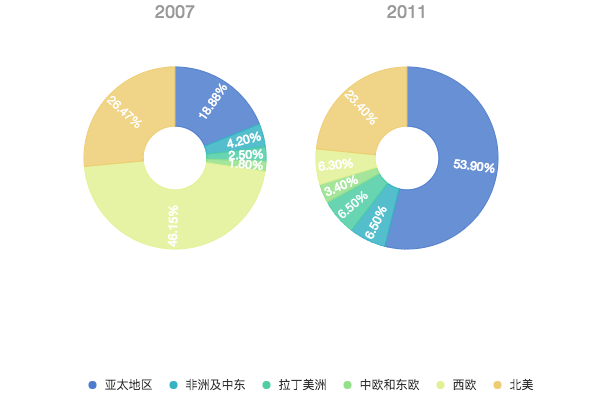
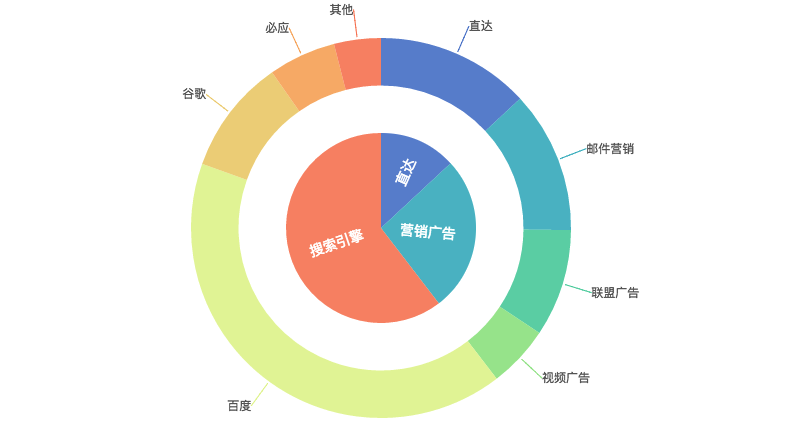
饼图
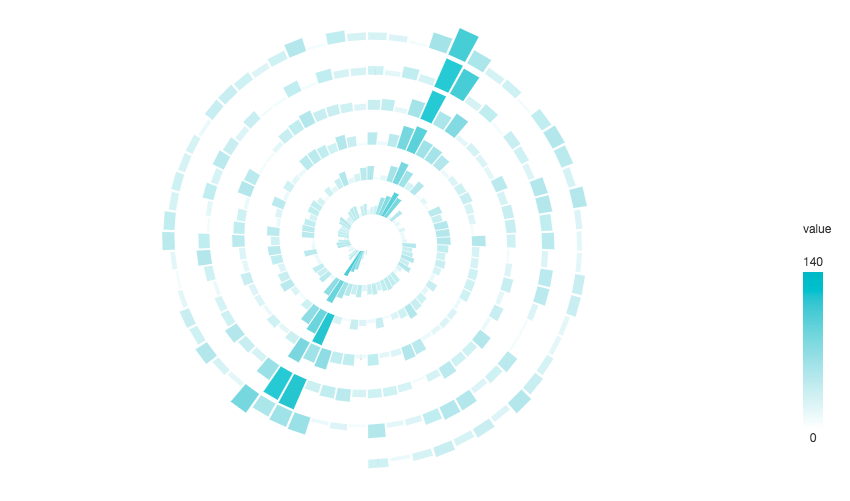
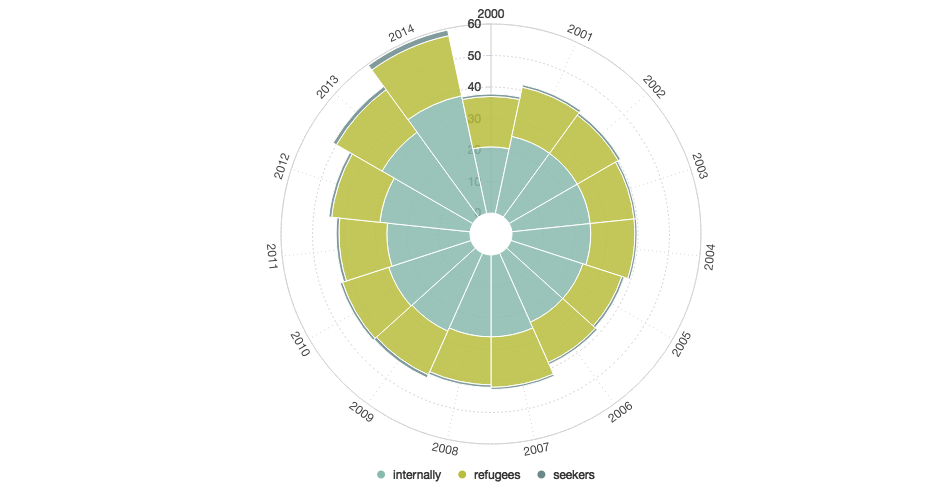
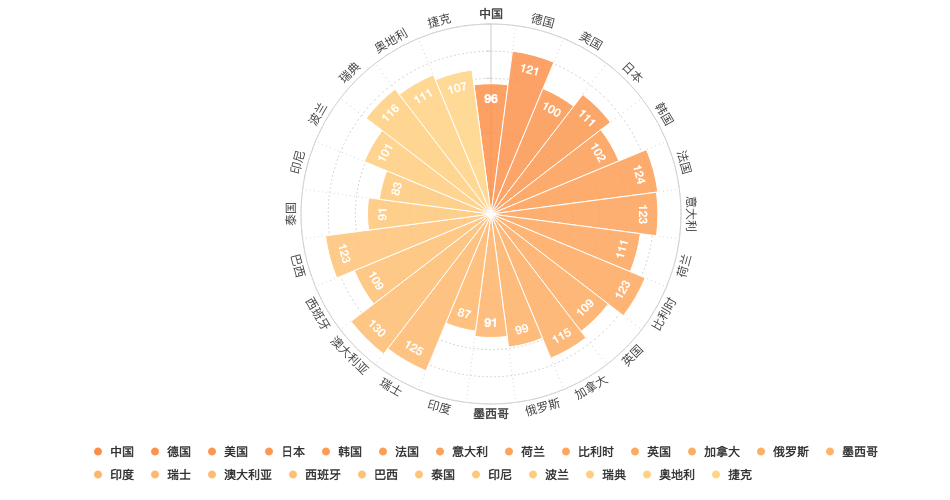
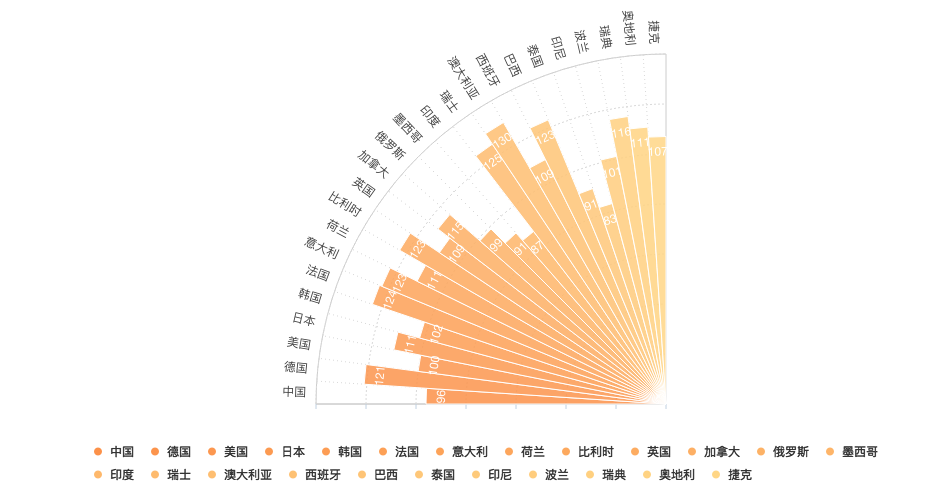
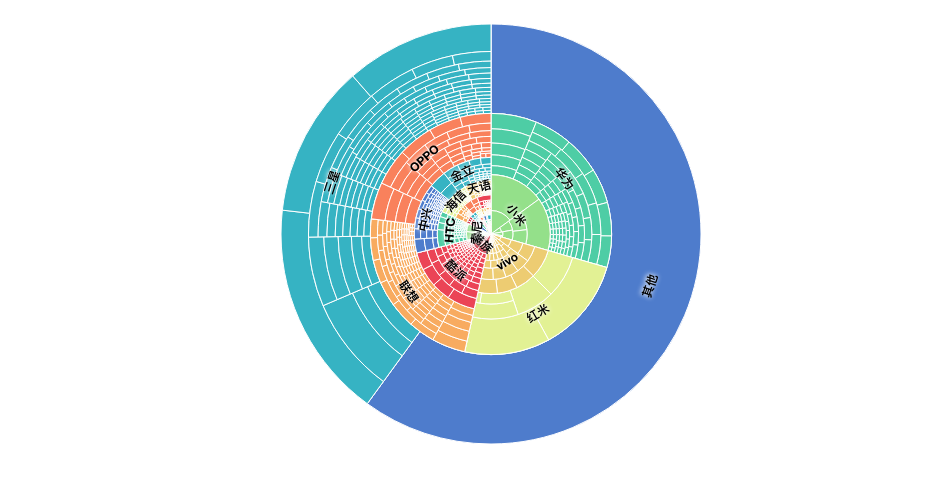
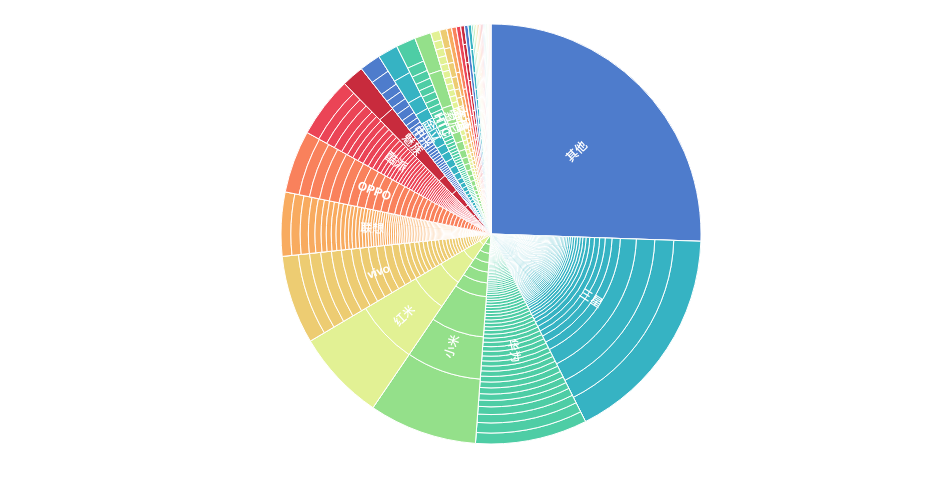
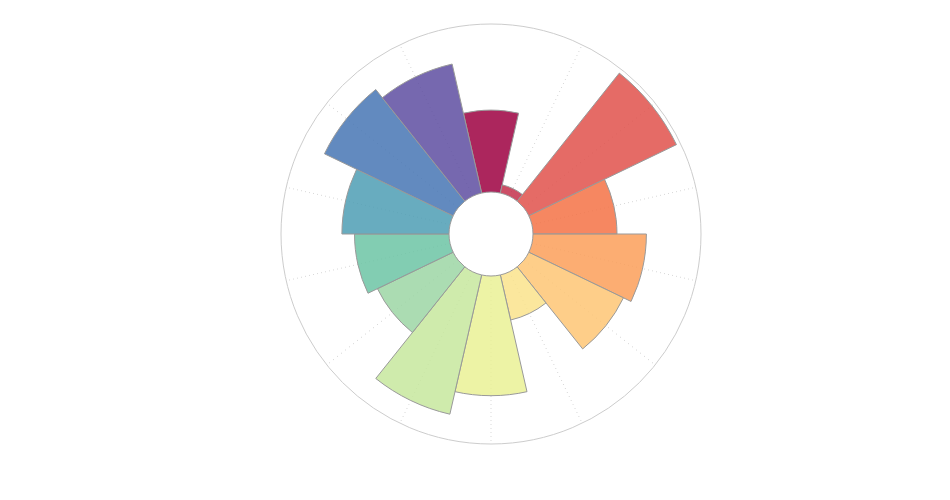
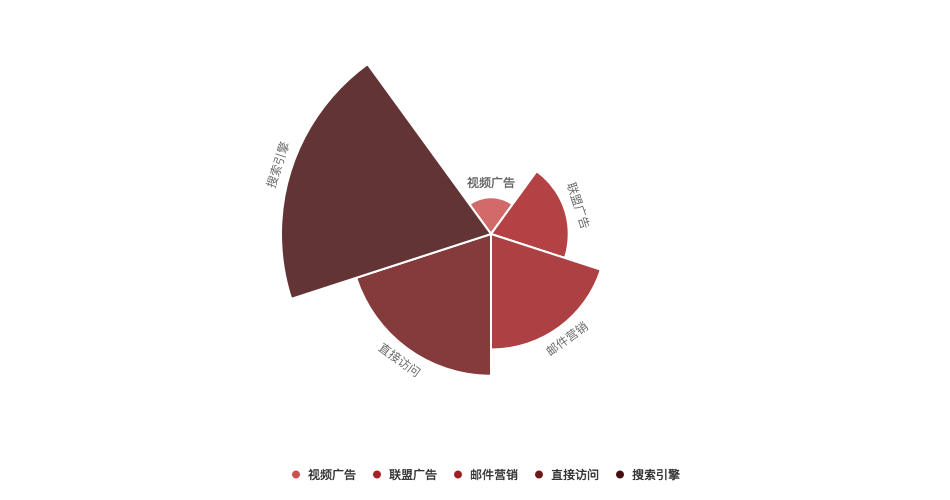
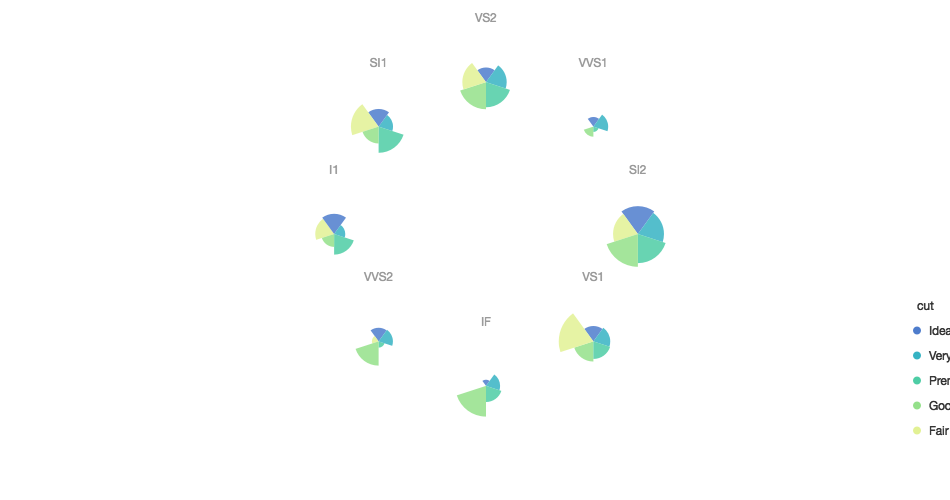
南丁格尔玫瑰图
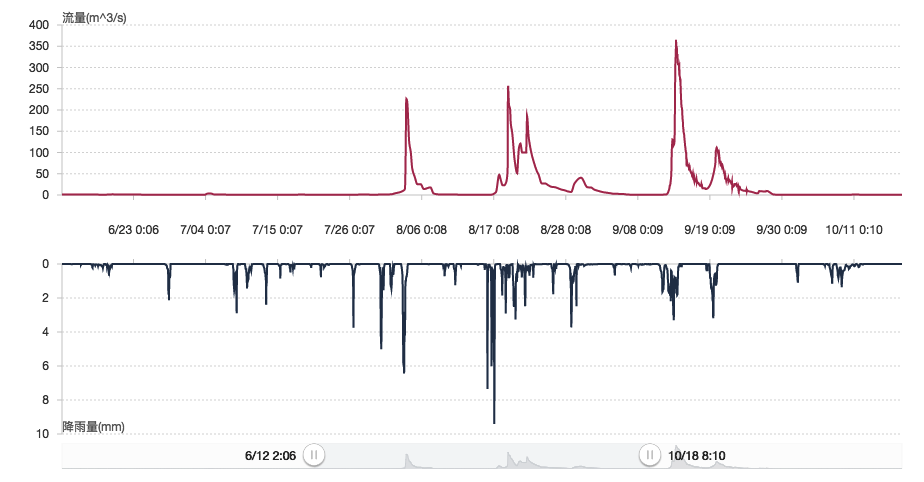
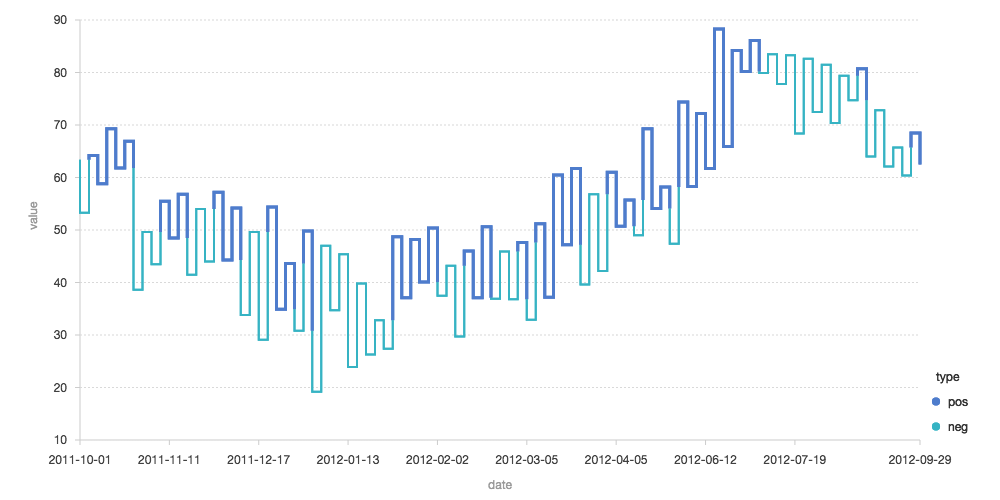
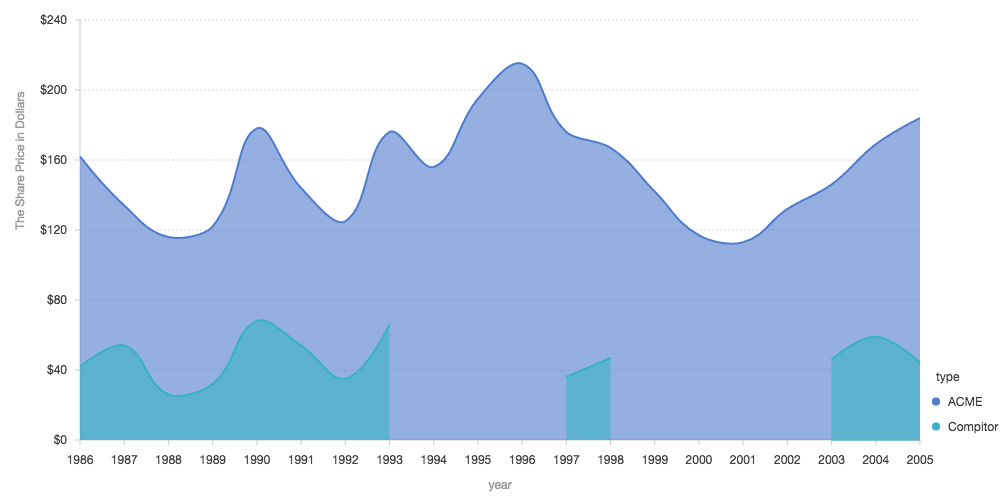
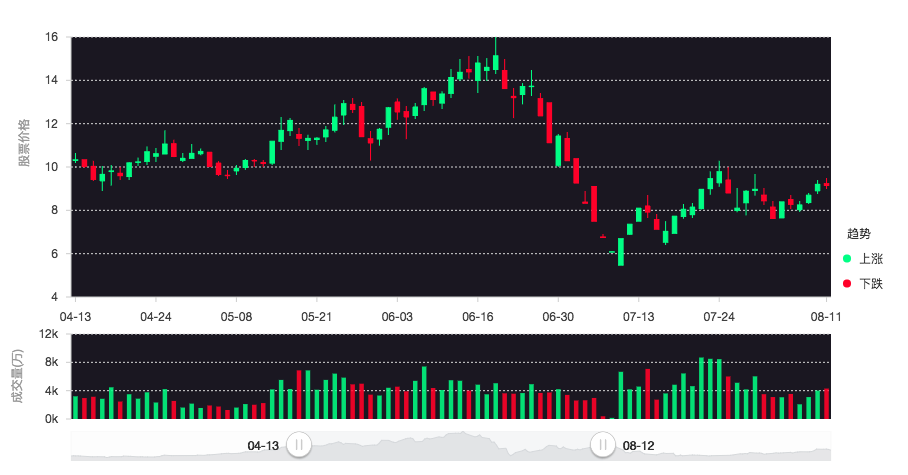
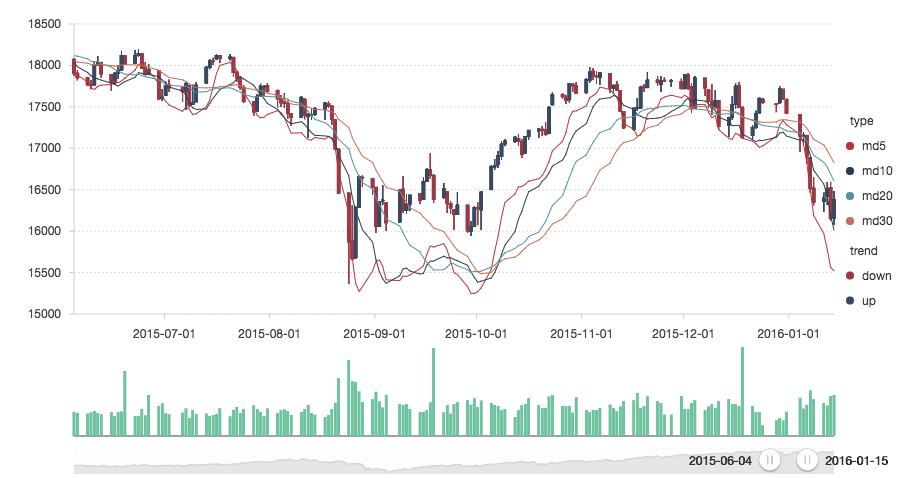
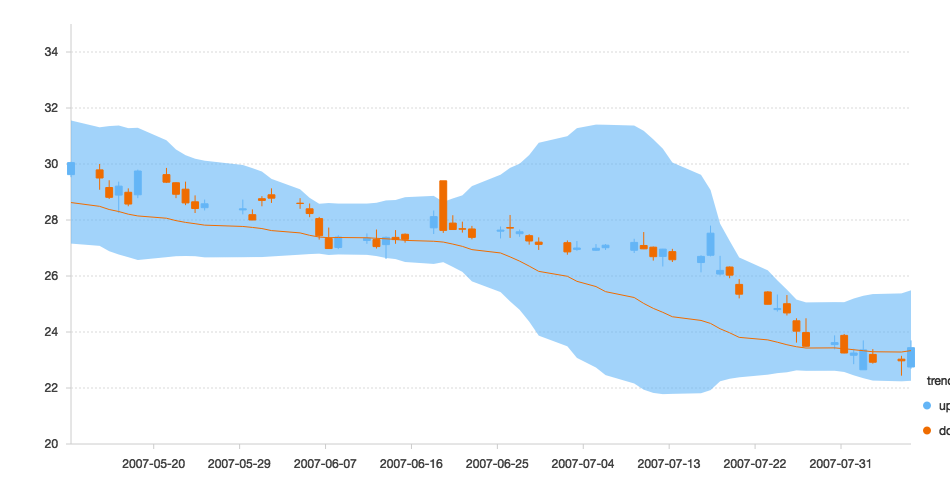
股票图
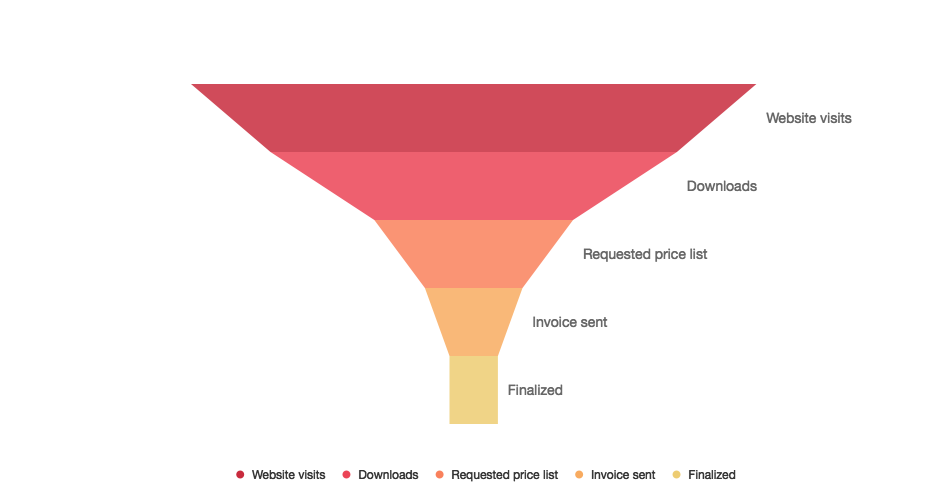
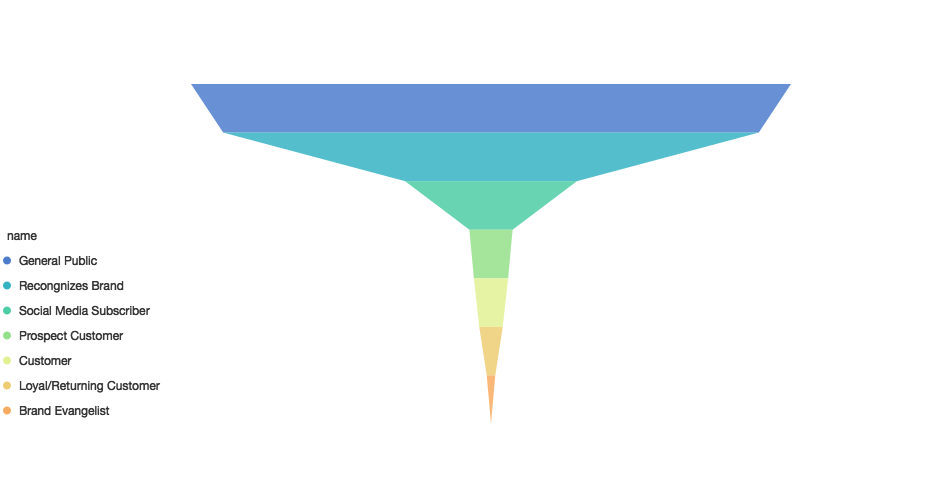
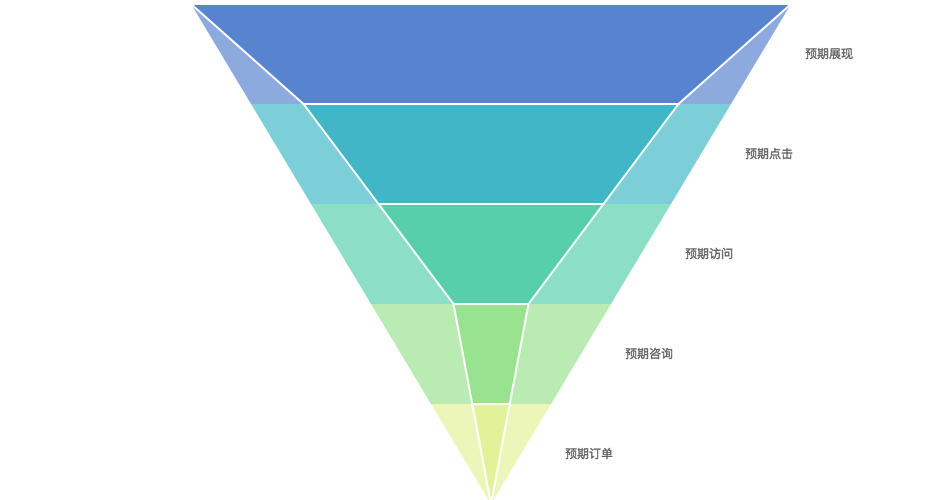
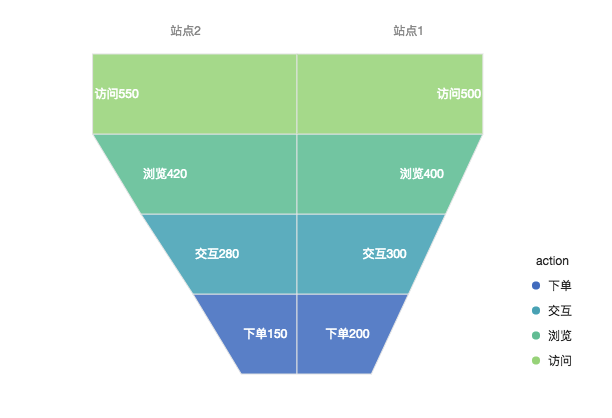
漏斗图
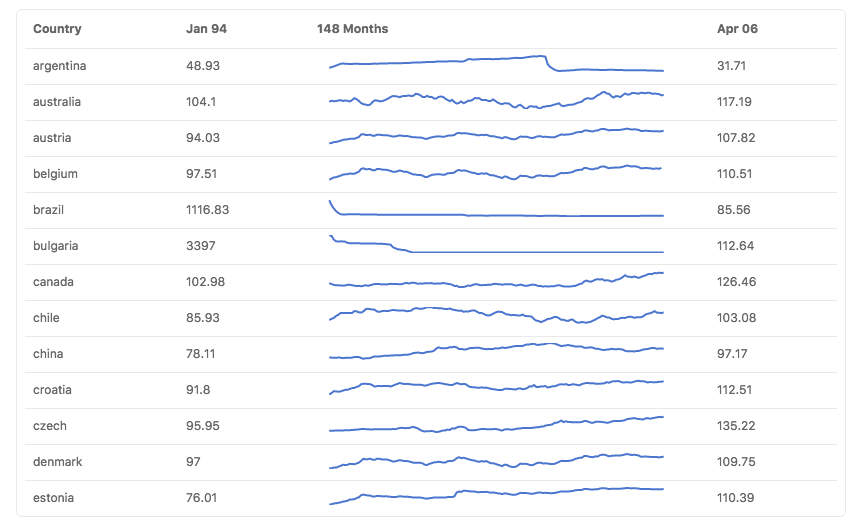
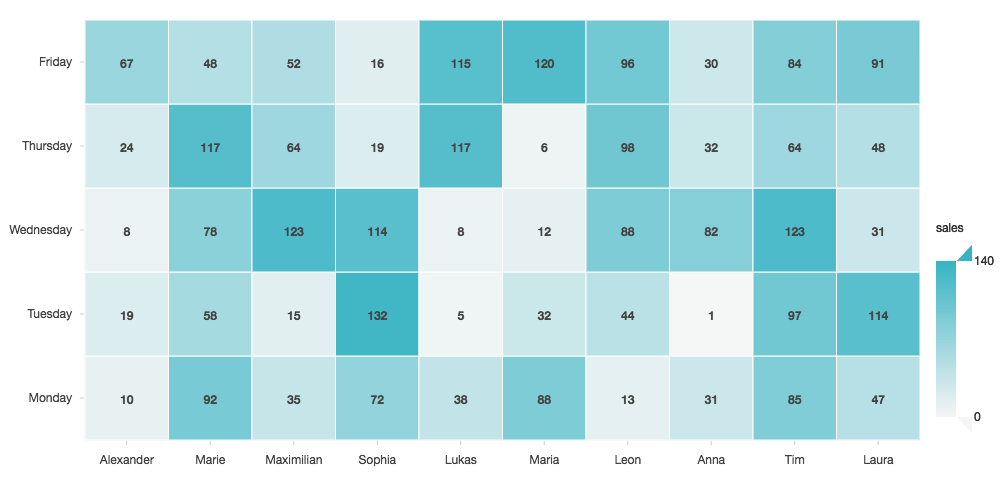
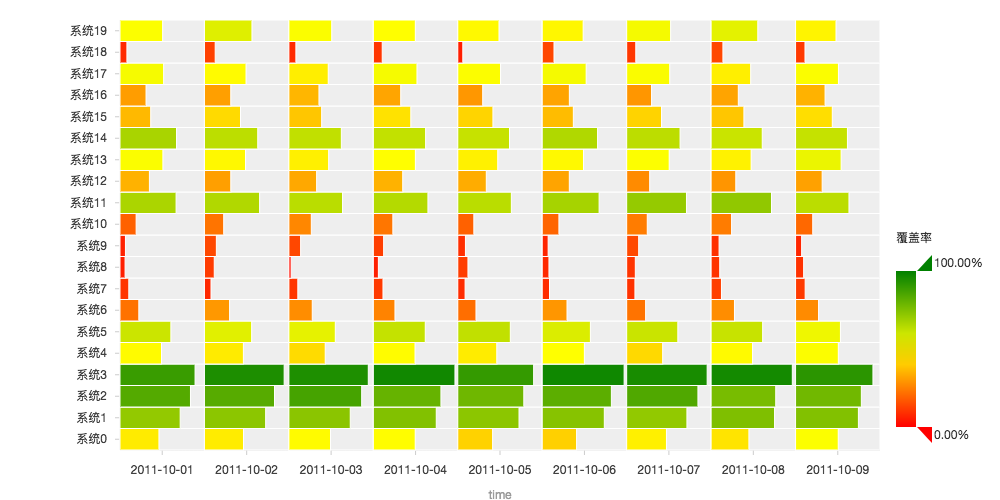
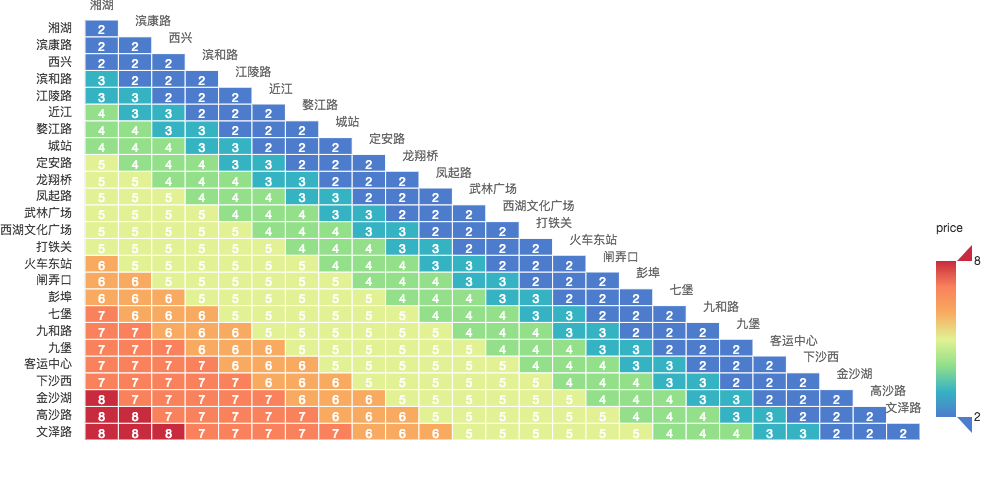
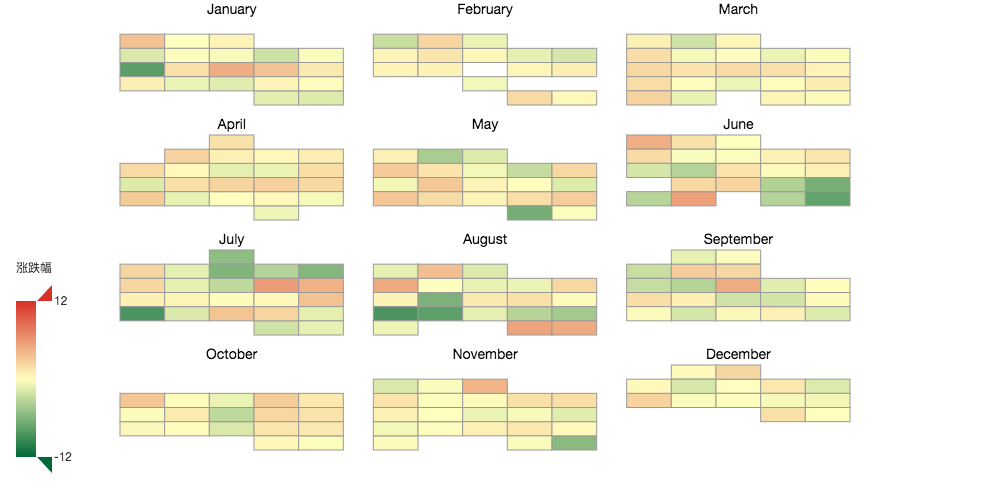
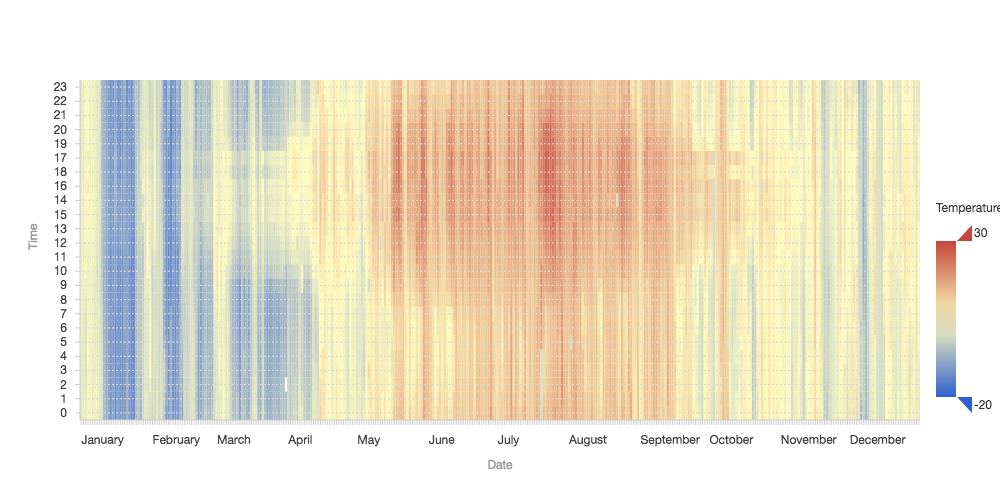
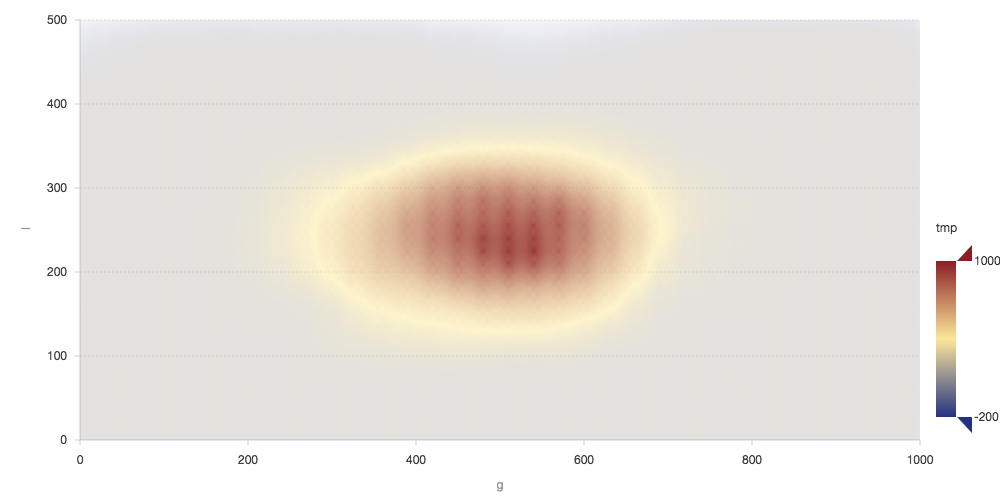
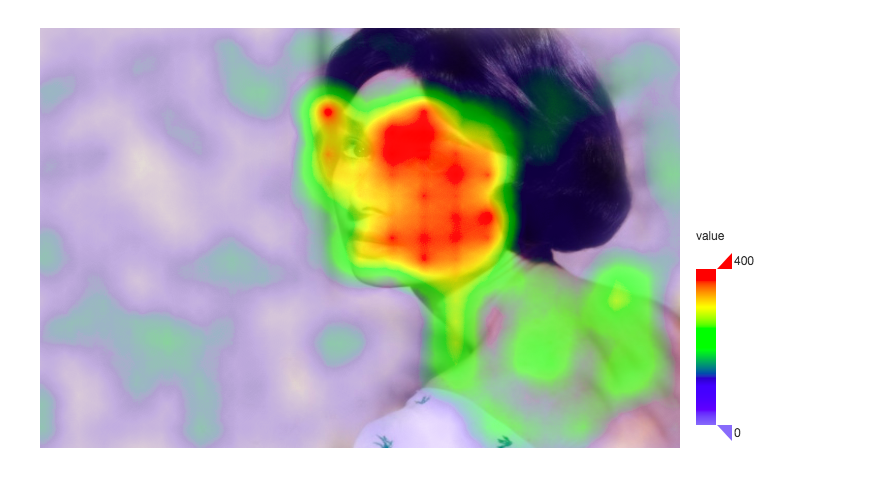
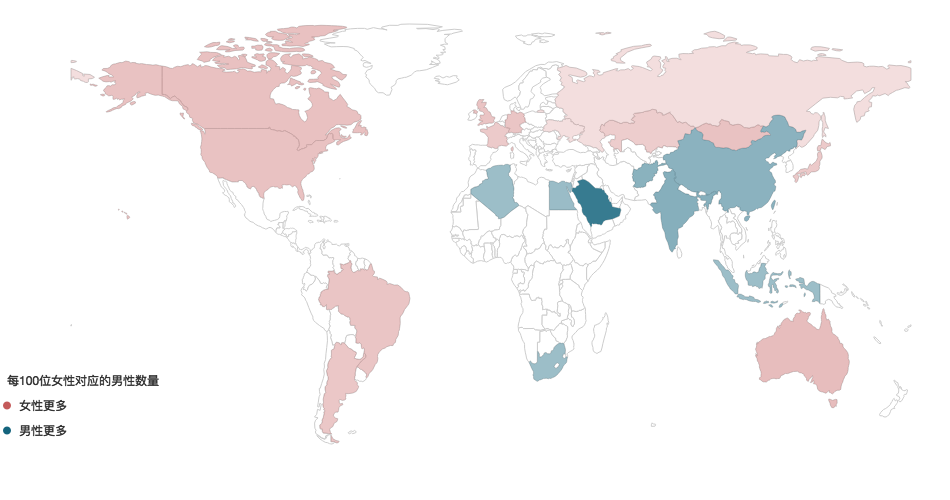
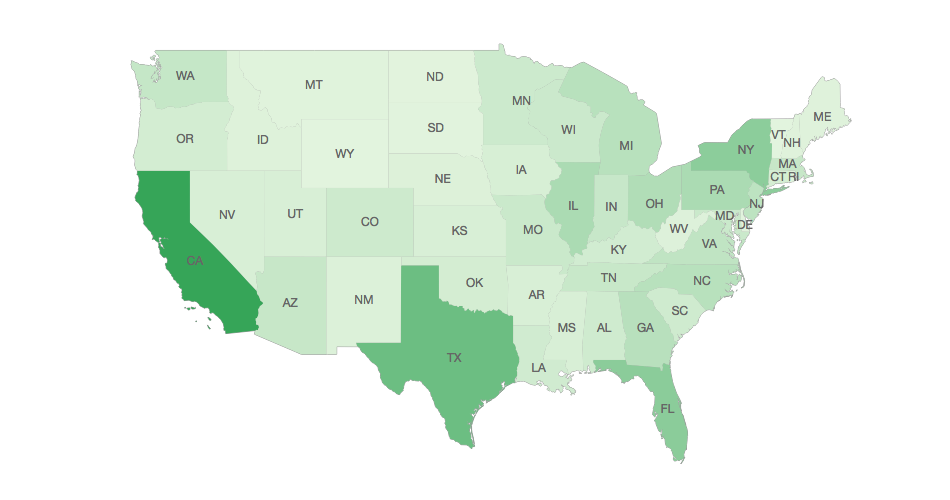
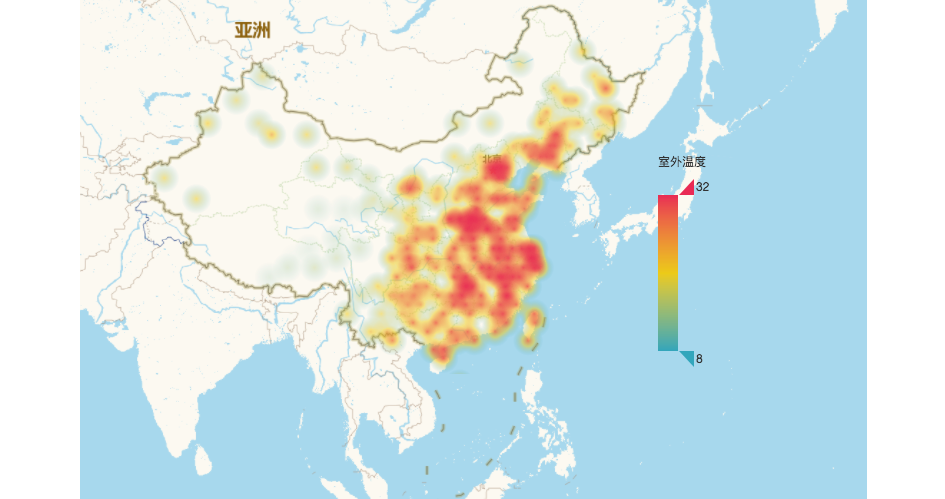
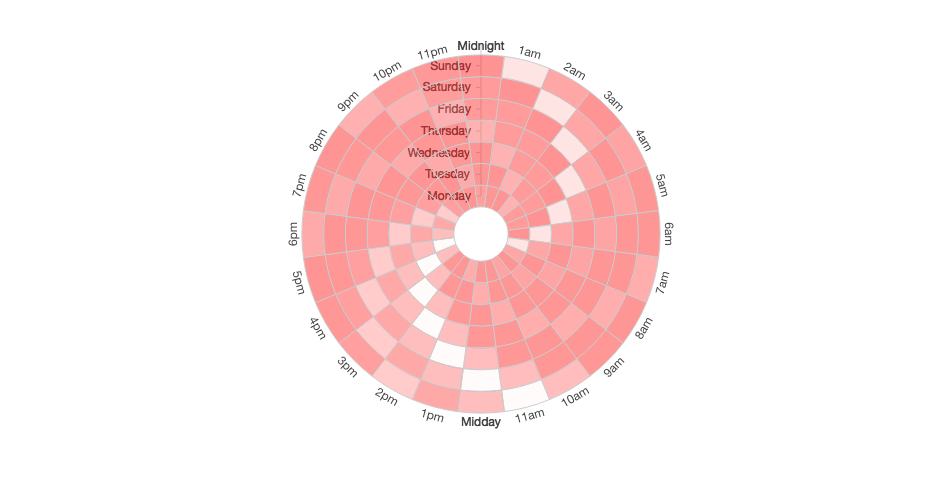
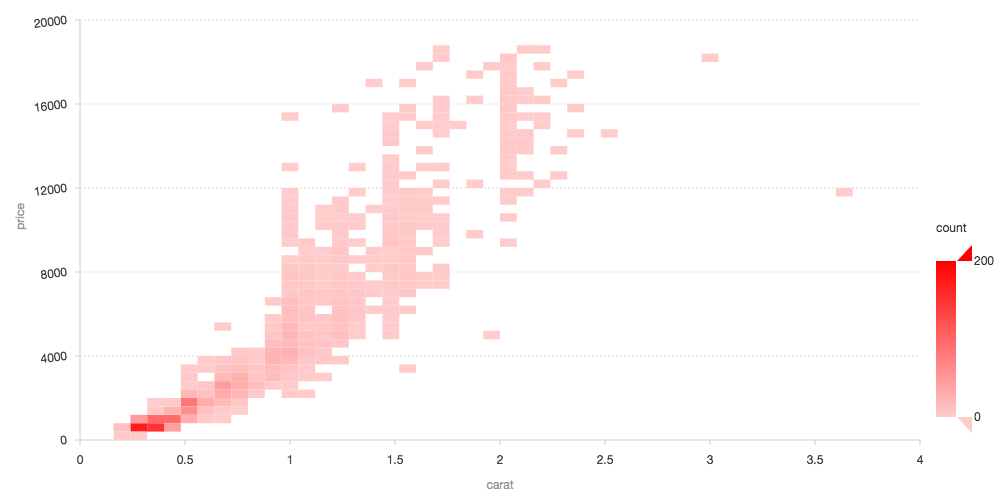
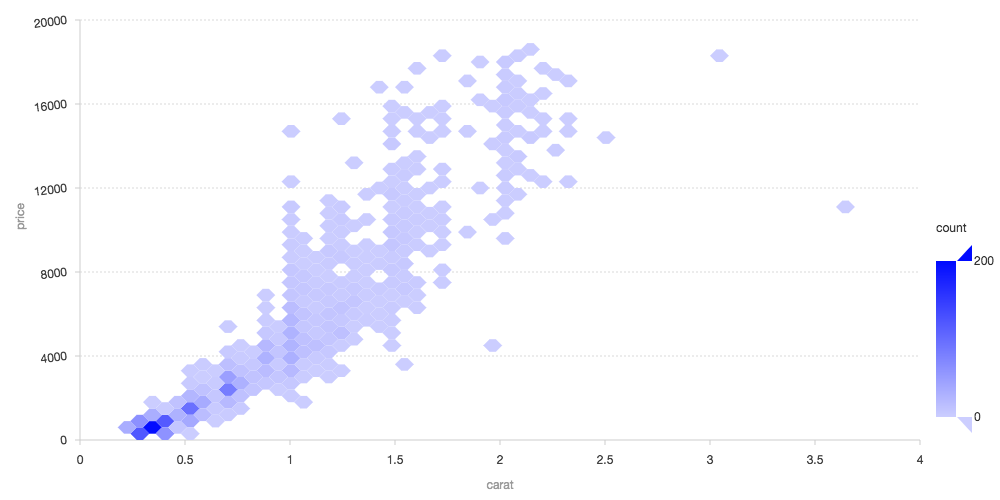
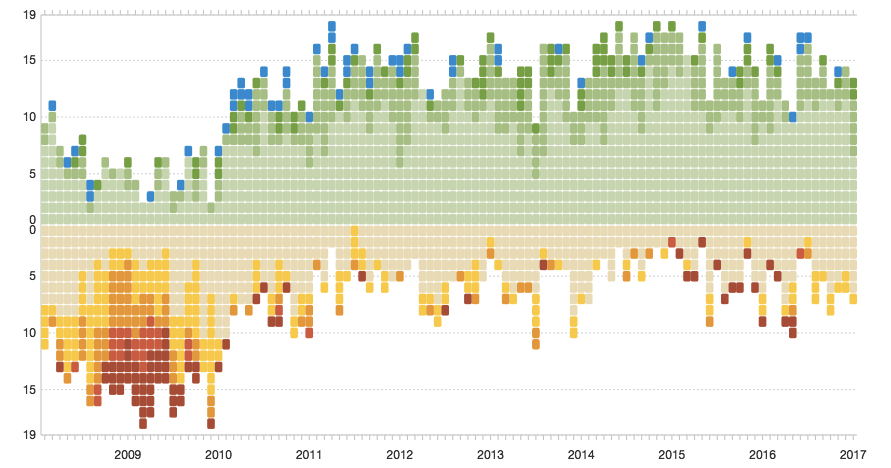
热力或色块图
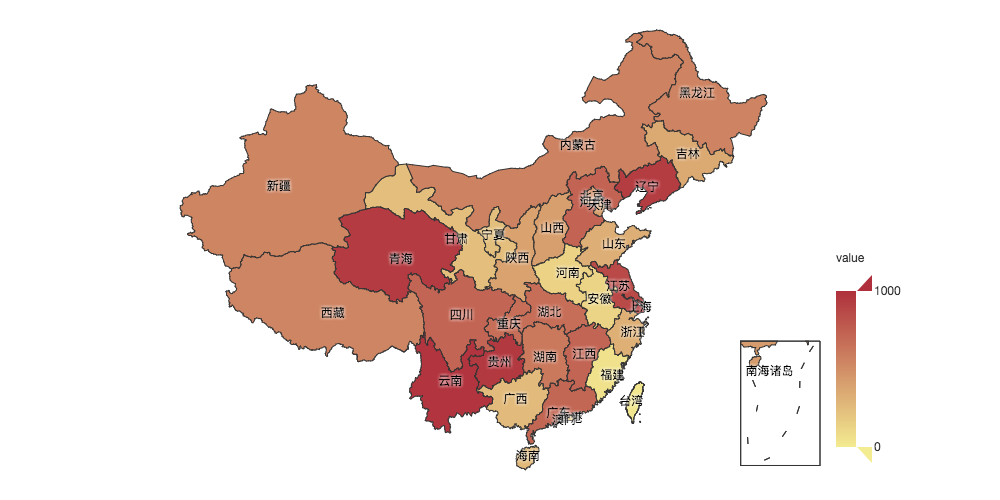
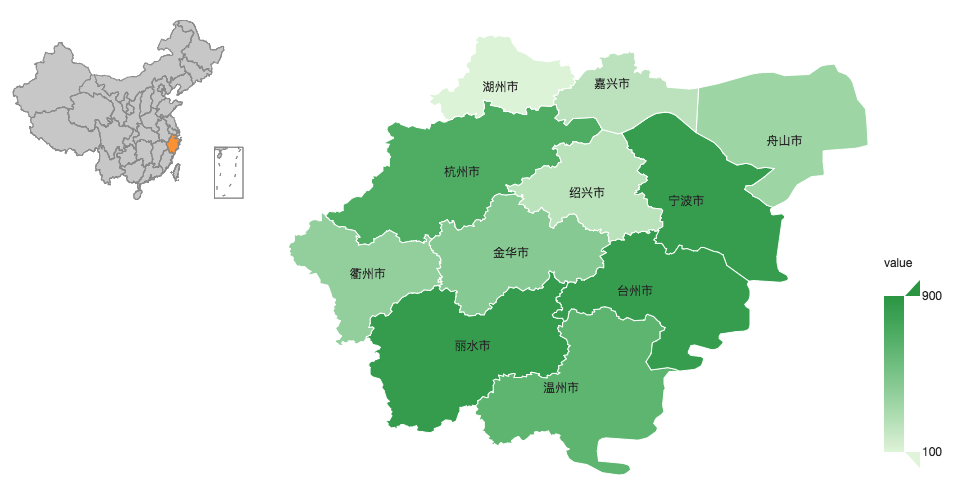
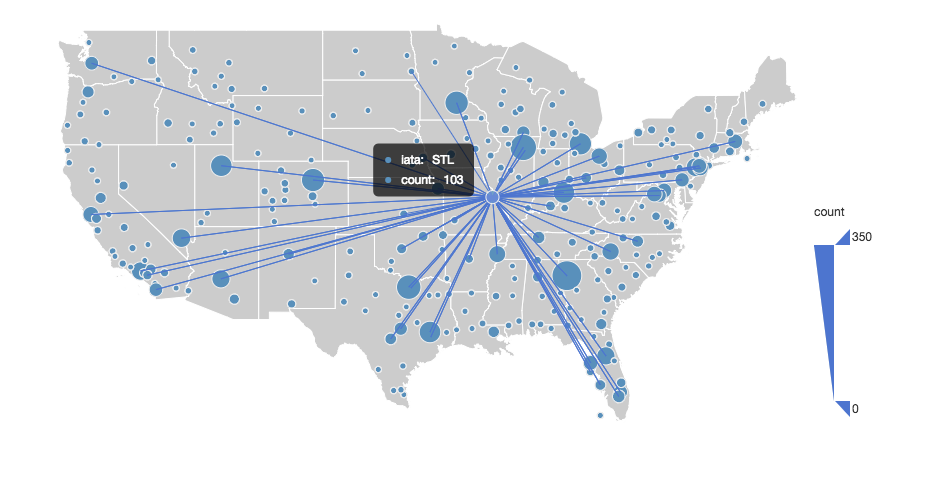
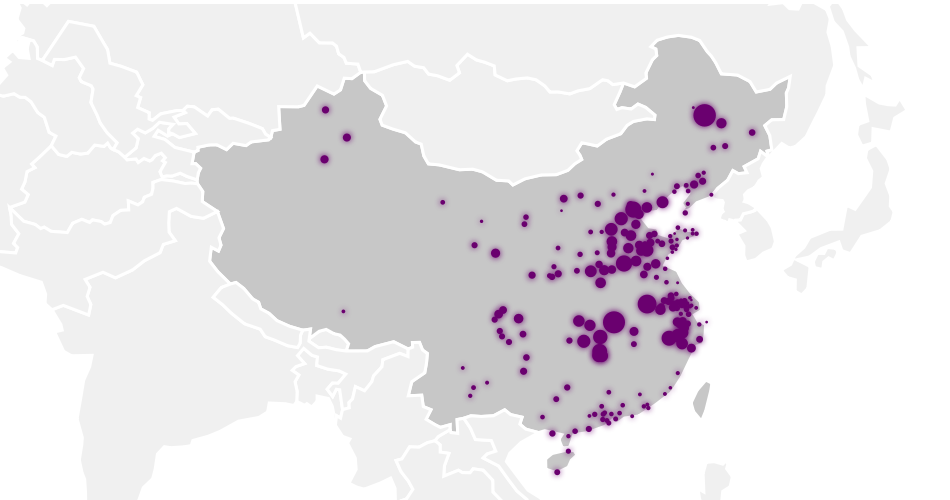
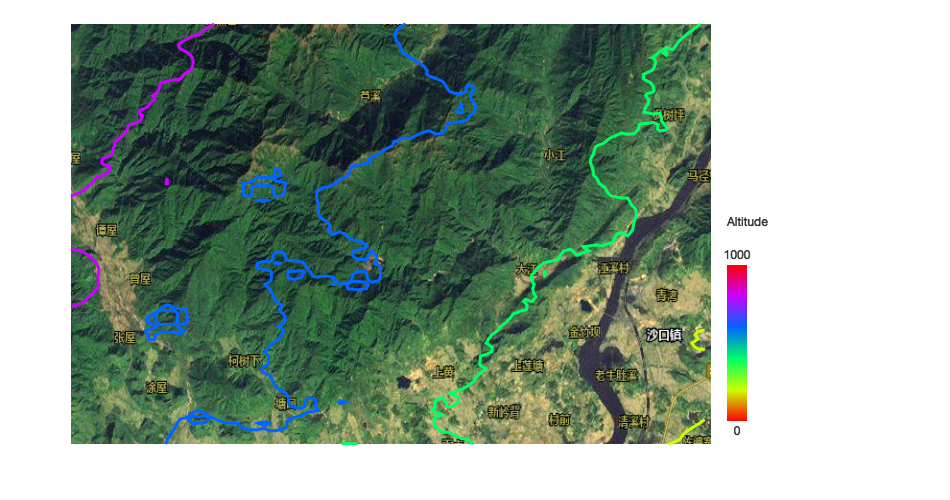
地图
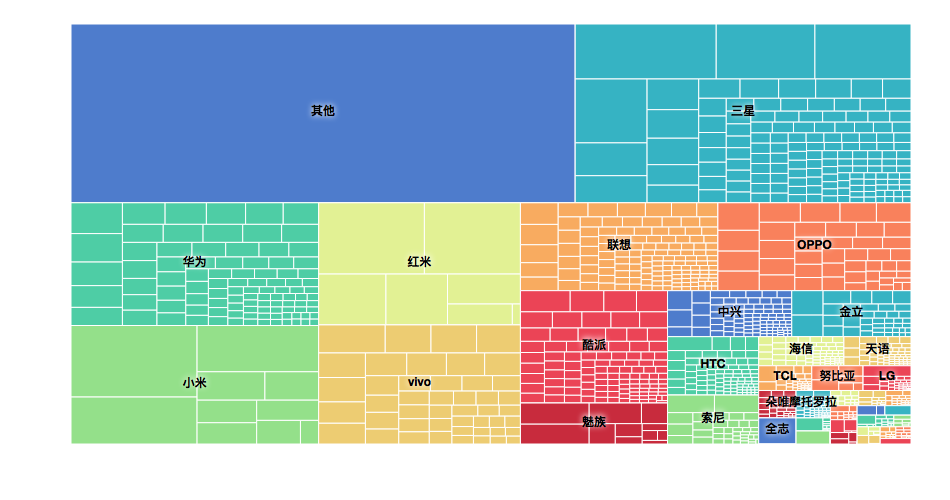
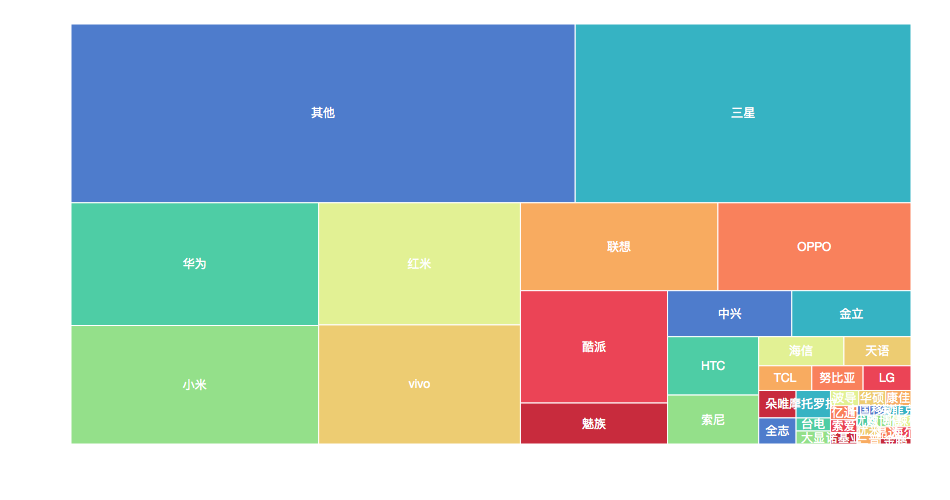
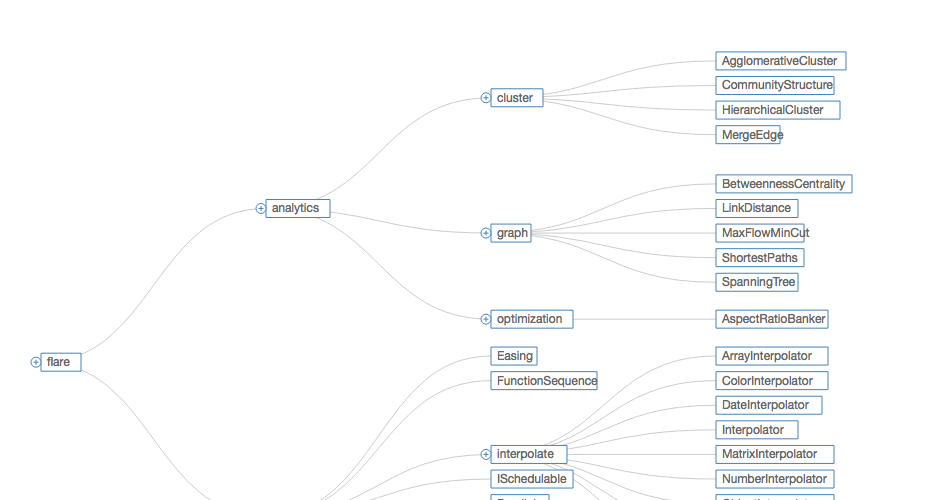
treemap
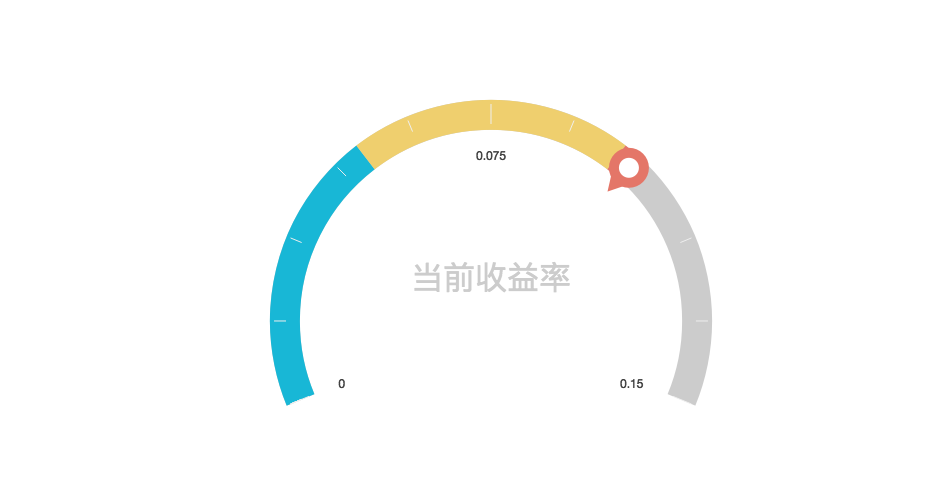
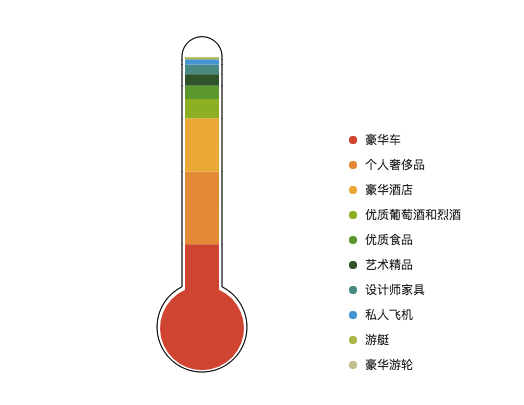
仪表盘
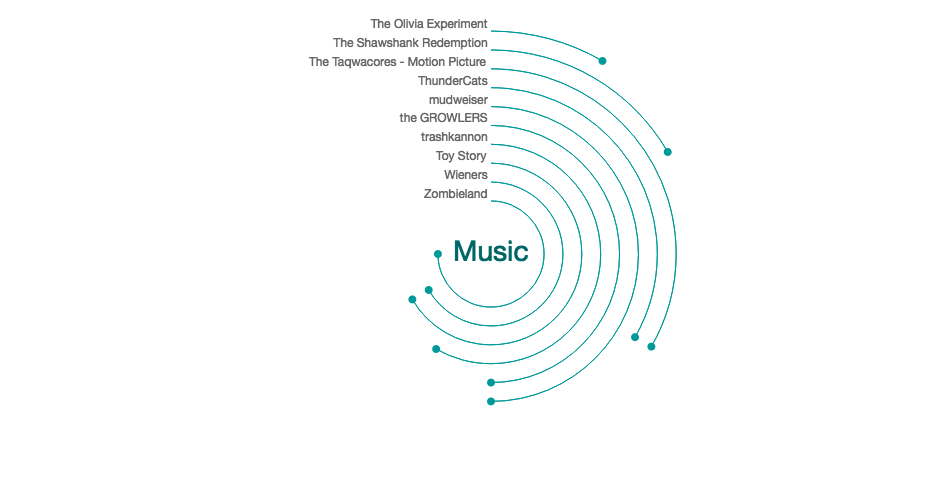
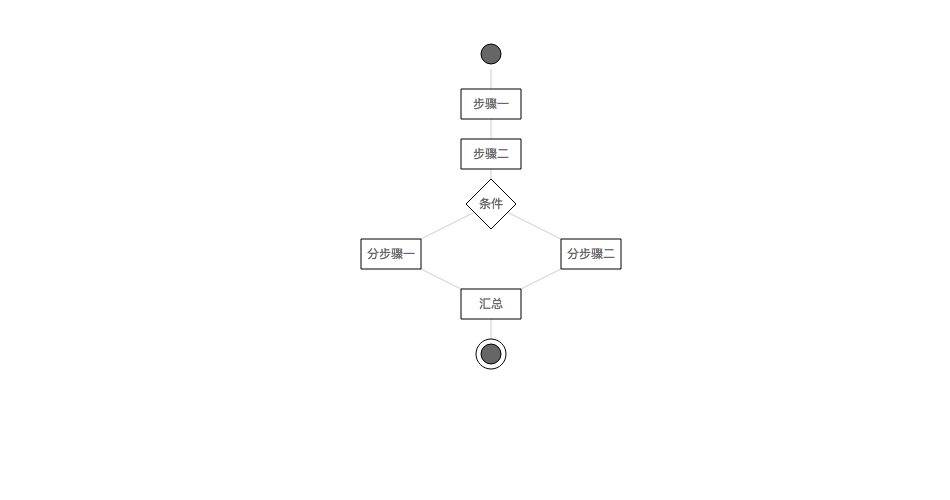
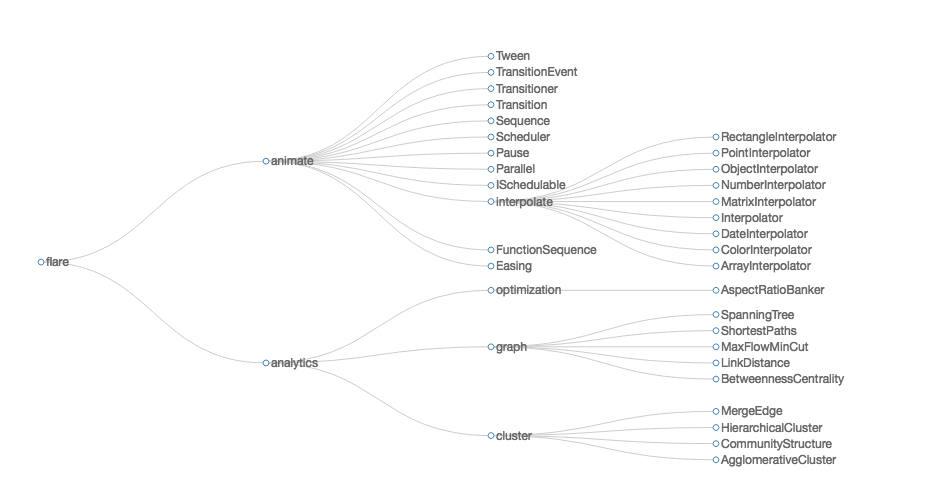
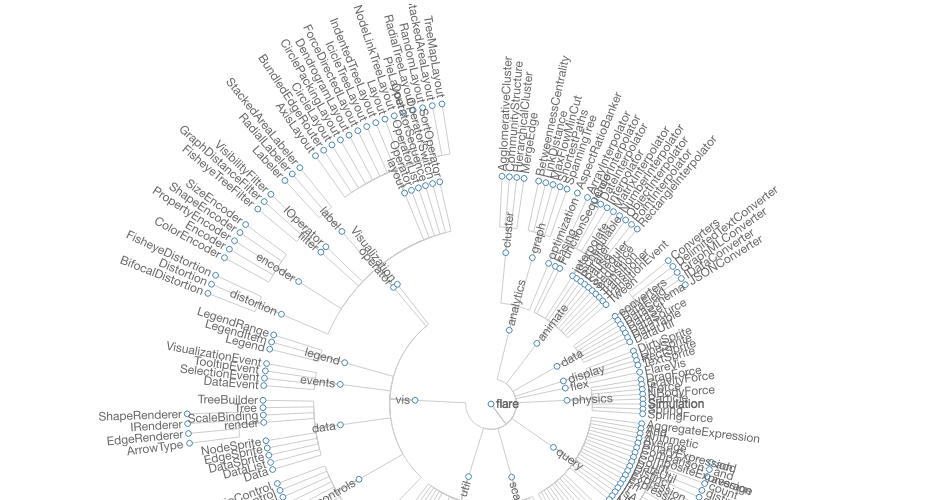
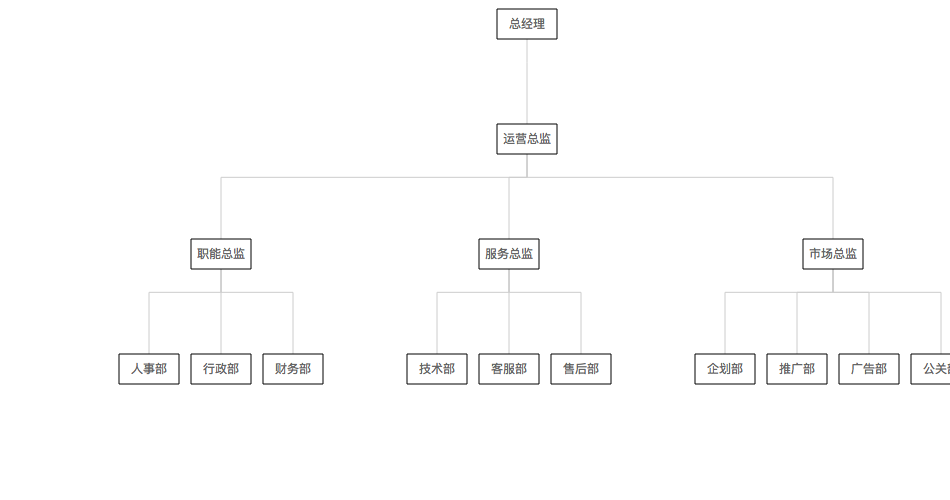
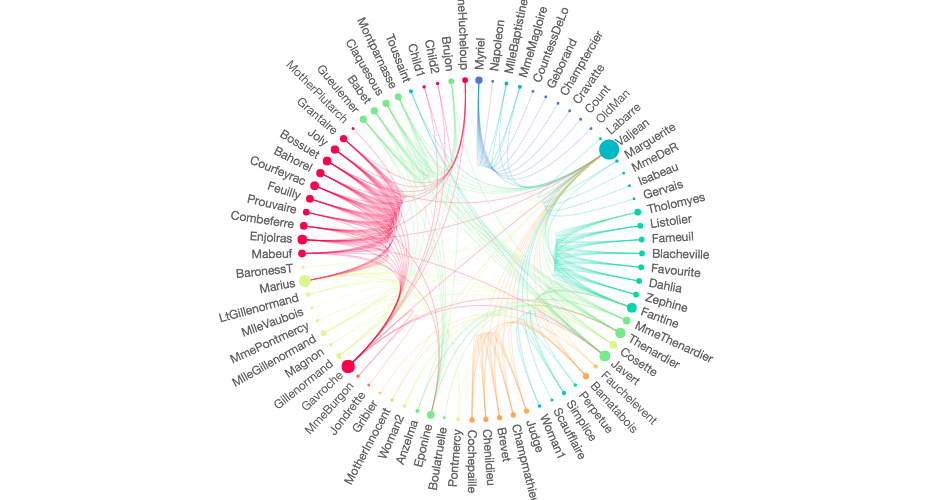
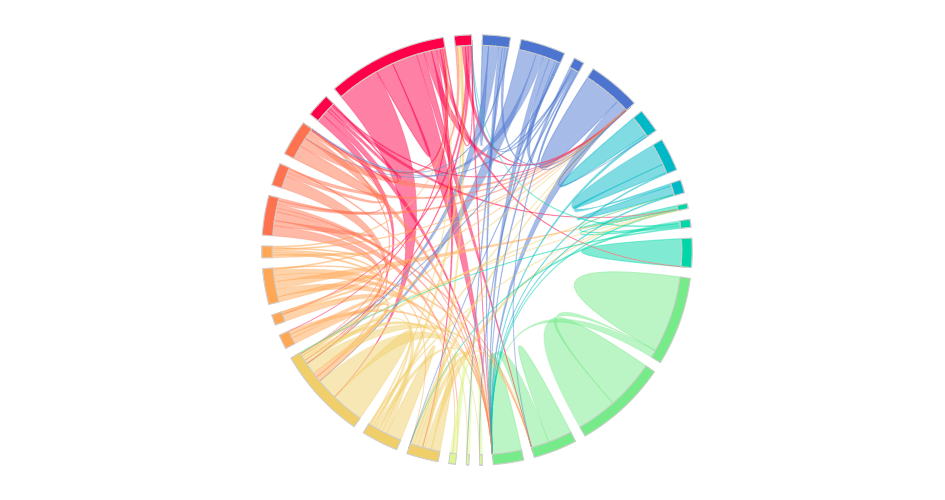
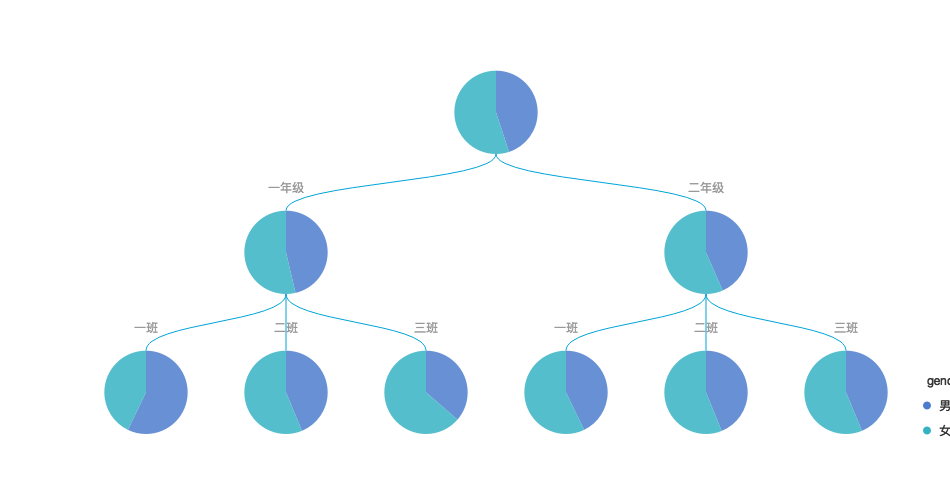
关系图
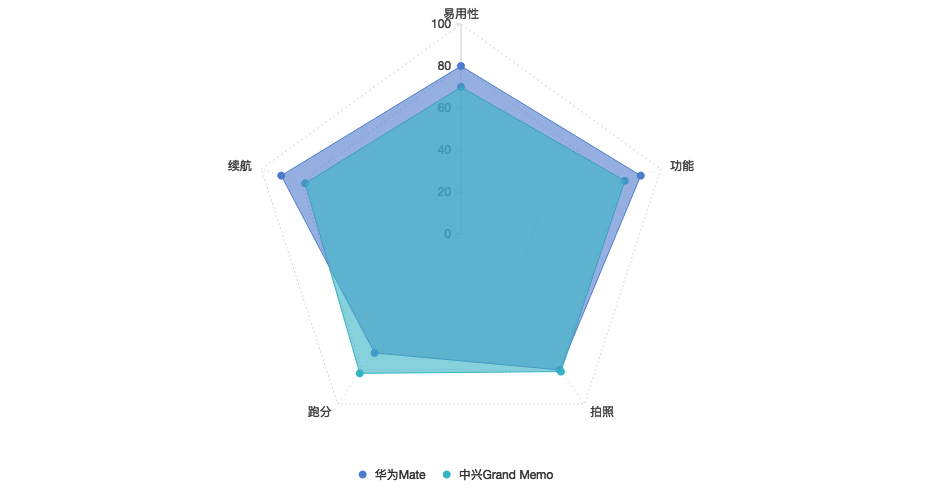
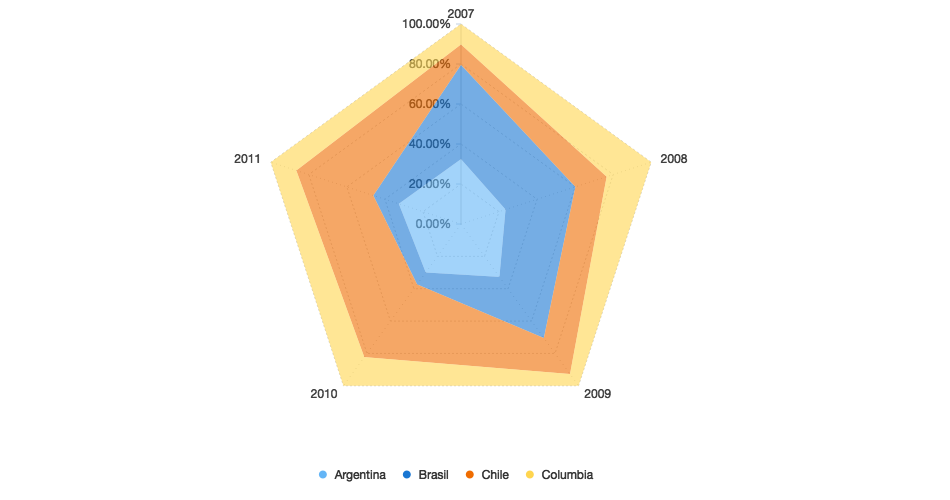
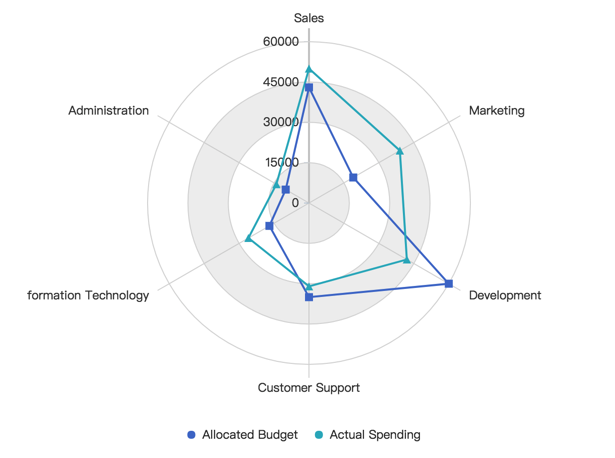
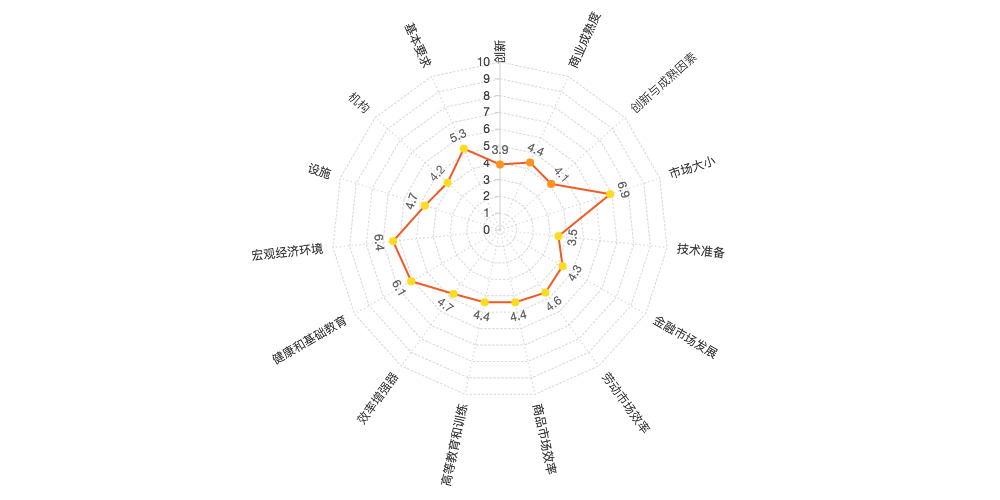
雷达图
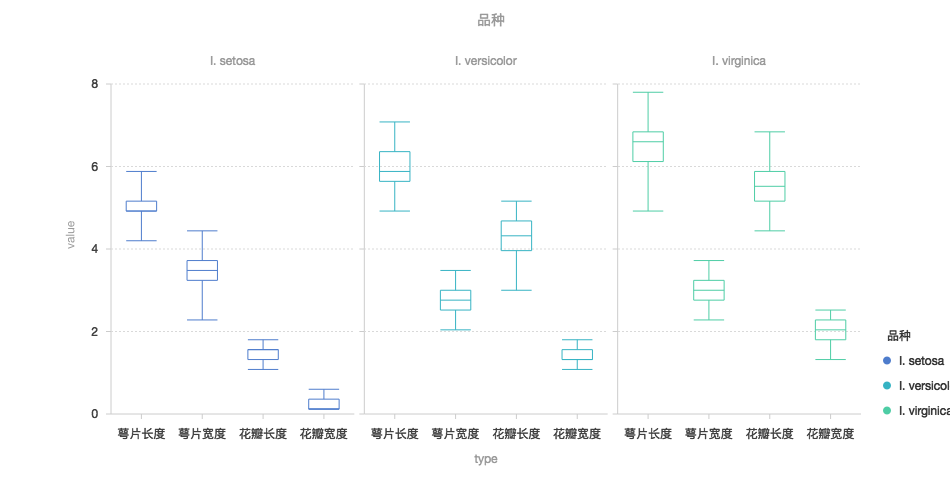
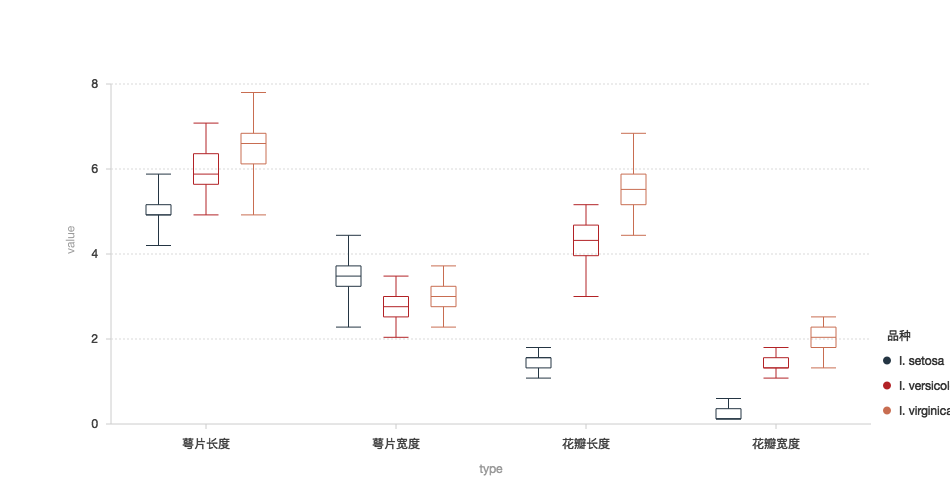
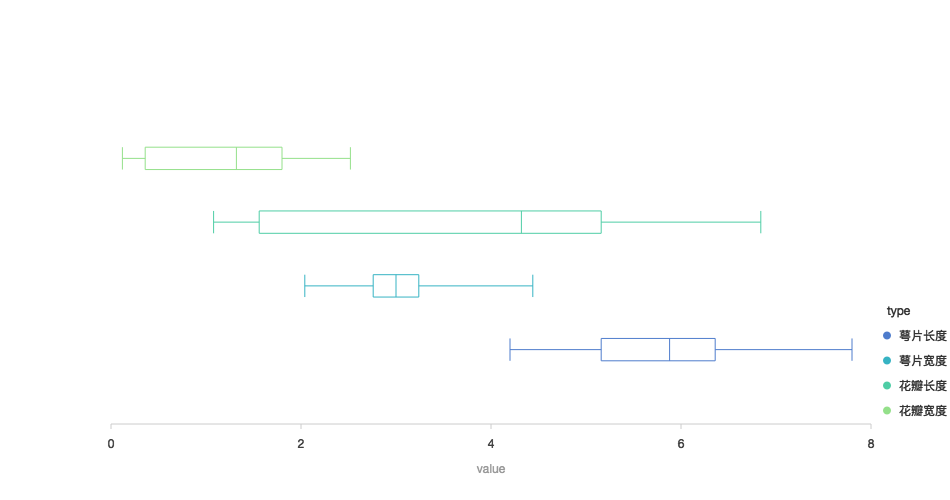
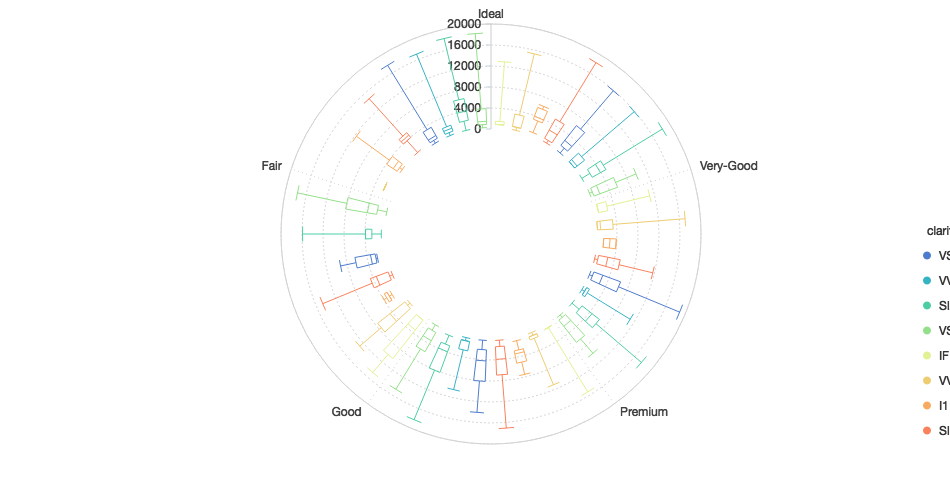
箱型图
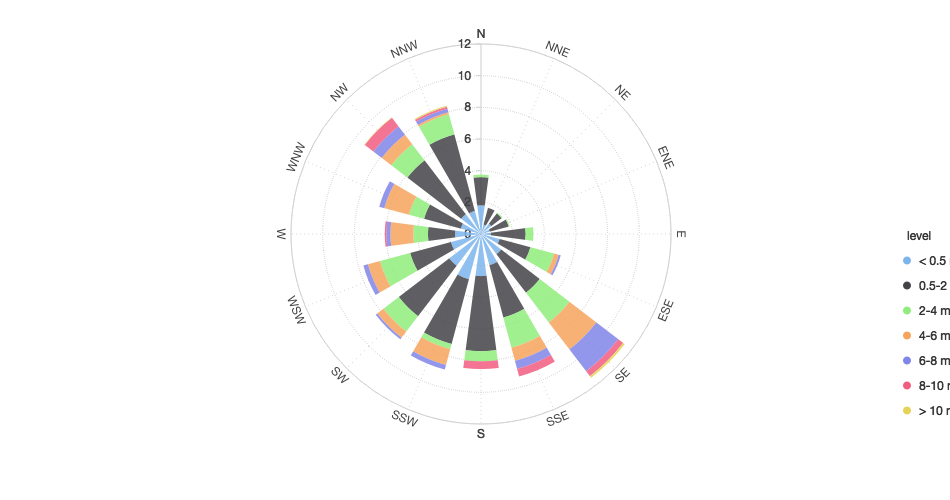
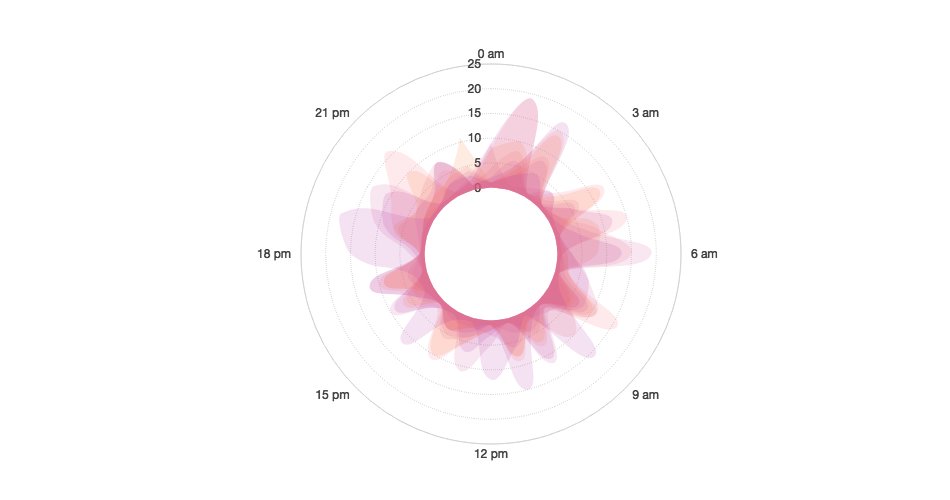
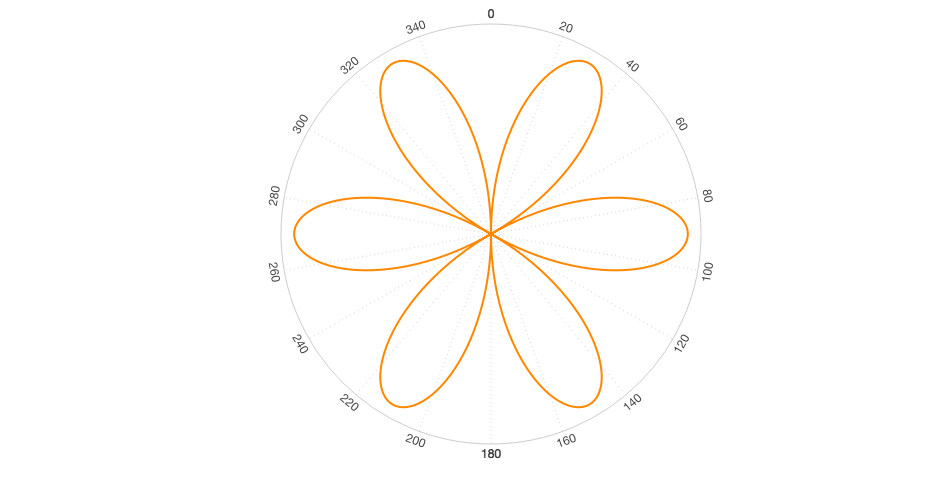
极坐标
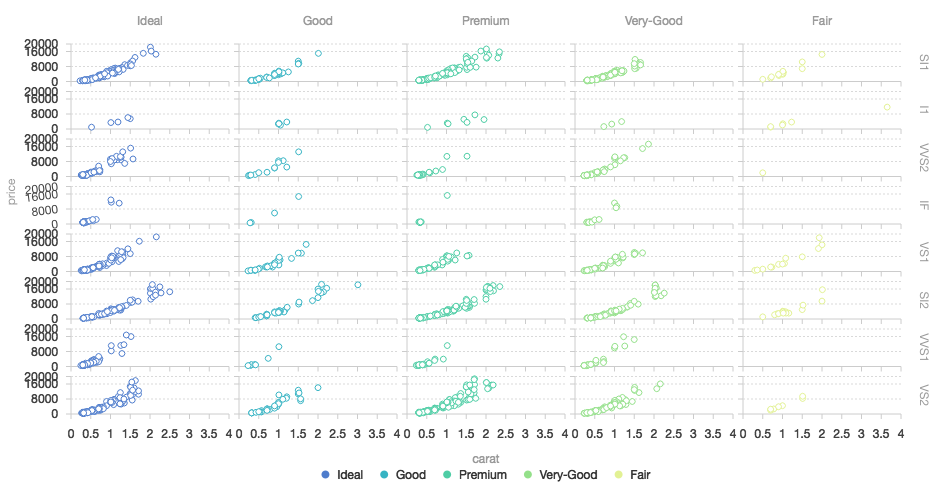
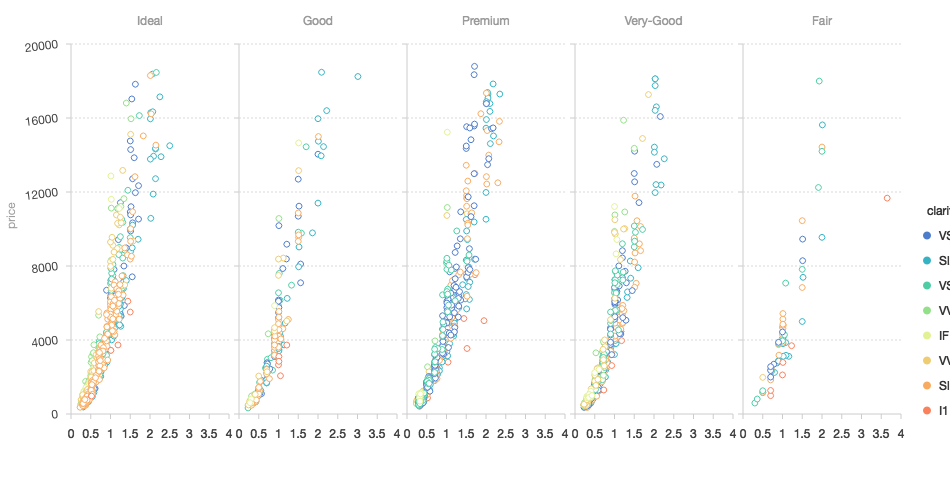
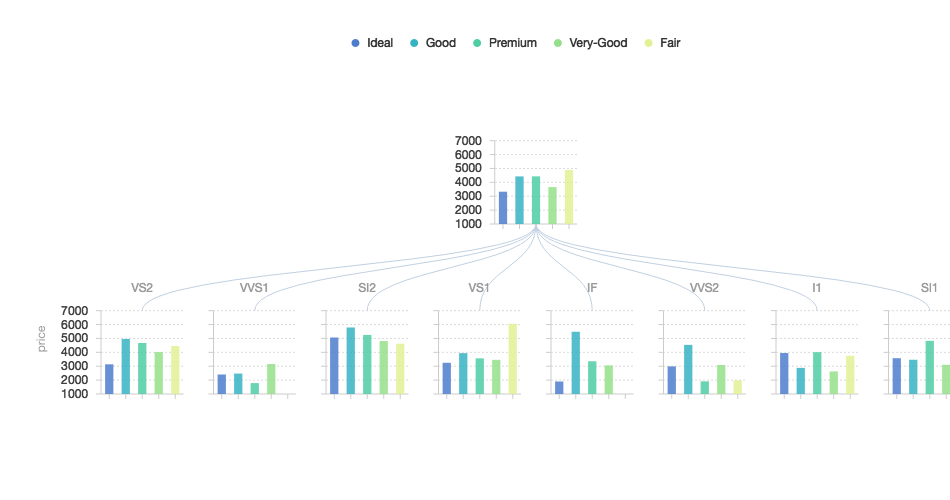
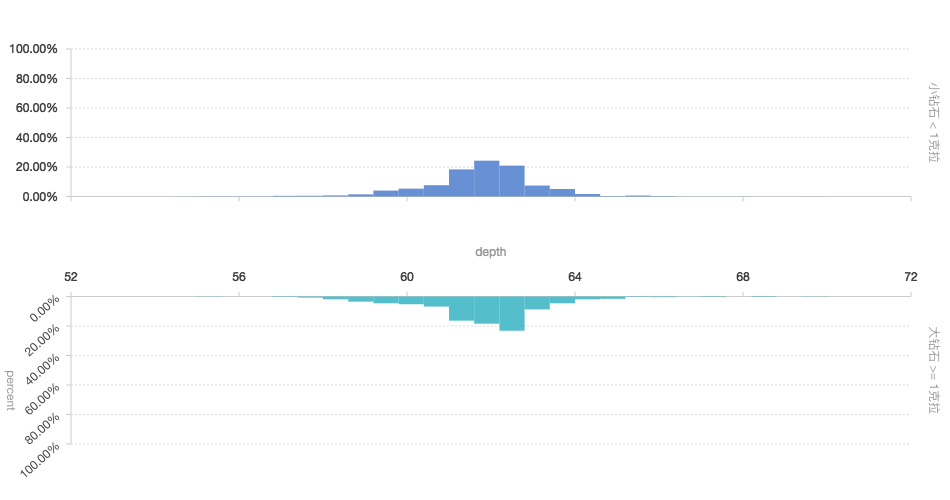
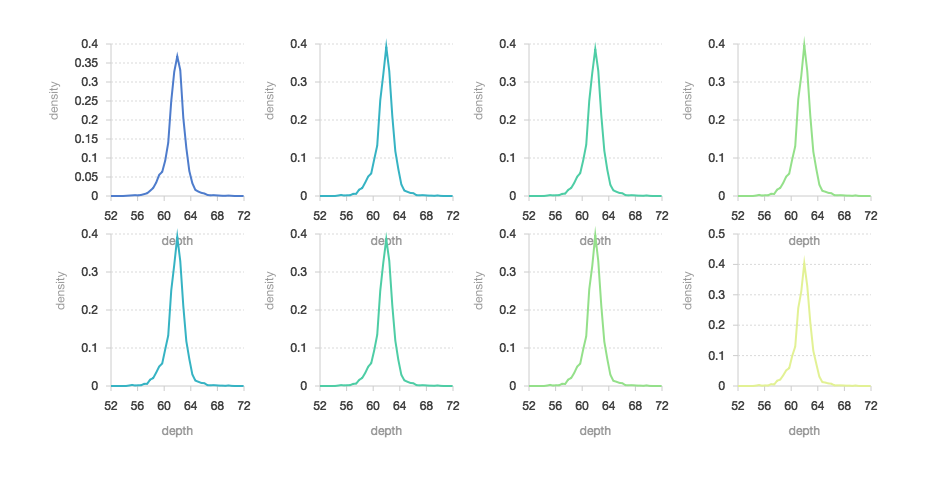
分面
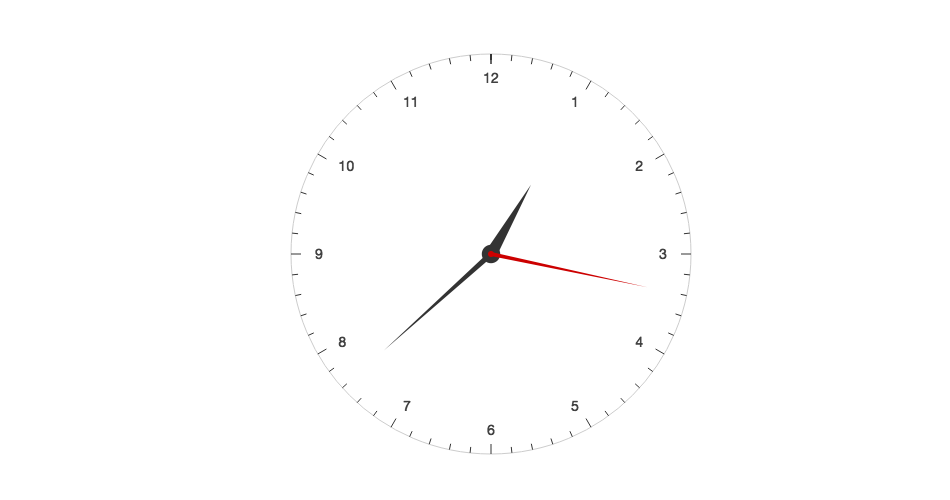
其他图表
gallery
源码
g2-react
运行
复制
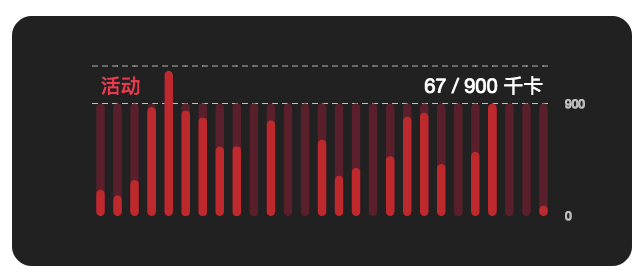
<!DOCTYPE html> <html> <head> <meta charset="utf-8"> <title>圆角柱状图</title> <script src="https://a.alipayobjects.com/jquery/jquery/1.11.1/jquery.js"></script> <script src="https://gw.alipayobjects.com/as/g/datavis/g2/2.3.13/index.js"></script> </head> <body> <div id="c1"></div> <script> // 自定义 shape, 支持图片形式的气泡 var Shape = G2.Shape; Shape.registShape('interval', 'borderRadius', { drawShape(cfg, container) { var points = cfg.points; var path = []; path.push(['M', points[0].x, points[0].y]); path.push(['L', points[1].x, points[1].y]); path.push(['L', points[2].x, points[2].y]); path.push(['L', points[3].x, points[3].y]); path.push('Z'); path = this.parsePath(path); // 将 0 - 1 转化为画布坐标 return container.addShape('rect', { attrs: { x: path[1][1], // 矩形起始点为左上角 y: path[1][2], width: path[2][1] - path[1][1], height: path[0][2] - path[1][2], fill: cfg.color, radius: (path[2][1] - path[1][1]) / 2, }, }); }, }); var activeData = [ { date: '2017年3月2日', actual: 175, expected: 900 }, { date: '2017年3月3日', actual: 137, expected: 900 }, { date: '2017年3月4日', actual: 240, expected: 900 }, { date: '2017年3月5日', actual: 726, expected: 900 }, { date: '2017年3月6日', actual: 968, expected: 900 }, { date: '2017年3月7日', actual: 702, expected: 900 }, { date: '2017年3月8日', actual: 655, expected: 900 }, { date: '2017年3月9日', actual: 463, expected: 900 }, { date: '2017年3月10日', actual: 464, expected: 900 }, { date: '2017年3月12日', actual: 0, expected: 900 }, { date: '2017年3月13日', actual: 638, expected: 900 }, { date: '2017年3月14日', actual: 0, expected: 900 }, { date: '2017年3月15日', actual: 0, expected: 900 }, { date: '2017年3月16日', actual: 509, expected: 900 }, { date: '2017年3月17日', actual: 269, expected: 900 }, { date: '2017年3月18日', actual: 321, expected: 900 }, { date: '2017年3月19日', actual: 0, expected: 900 }, { date: '2017年3月20日', actual: 399, expected: 900 }, { date: '2017年3月21日', actual: 662, expected: 900 }, { date: '2017年3月22日', actual: 689, expected: 900 }, { date: '2017年3月23日', actual: 347, expected: 900 }, { date: '2017年3月24日', actual: 0, expected: 900 }, { date: '2017年3月26日', actual: 428, expected: 900 }, { date: '2017年3月27日', actual: 749, expected: 900 }, { date: '2017年3月28日', actual: 0, expected: 900 }, { date: '2017年3月29日', actual: 0, expected: 900 }, { date: '2017年3月30日', actual: 69.1, expected: 900 }, ]; var chart = new G2.Chart({ id: 'c1', forceFit: true, height: 250, plotCfg: { margin: [50, 80], border: { fill: '#2c2c2c', radius: 20 } } }); chart.source(activeData, { expected: { ticks: [0, 900, 1200] } }); chart.axis('date', false); chart.axis('actual', false); chart.axis('expected', { line: null, title: null, tickLine: null, labels: { label: { stroke: '#ccc' } }, grid: { line: { stroke:'#ccc', lineDash: [6, 4] } }, position: 'right', formatter: function(val) { if (val === '1200') { return ''; } return val; } }); chart.legend(false); chart.interval().position('date*expected').color('#752136').shape('borderRadius').opacity(0.6); chart.interval().position('date*actual').color('#db0d2d').shape('date*actual', function(date, val) { if (val === 0) { return; } else { return 'borderRadius'; } }); chart.guide().text([0, 950], '活动', { fill: '#ff2c55', fontSize: 20, fontWeight: 'bold' }); chart.guide().text([activeData.length - 8, 950], '67 / 900 千卡', { fill: '#fff', fontSize: 20 }); chart.render(); </script> </body> </html>
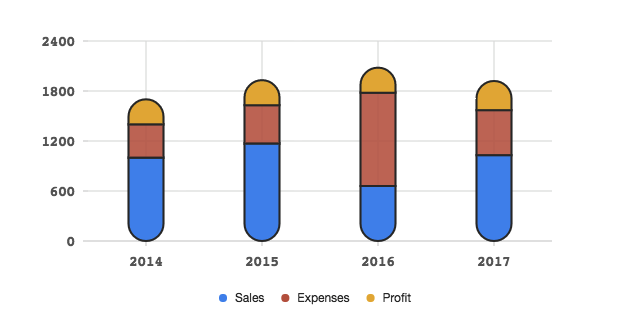
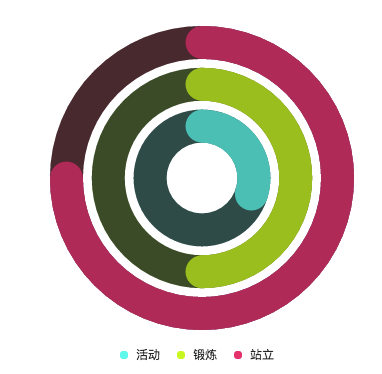
圆角柱状图
<!DOCTYPE html> <html> <head> <meta charset="utf-8"> <title>圆角柱状图</title> <script src="https://unpkg.com/react@15/dist/react.min.js"></script> <script src="https://unpkg.com/react-dom@15/dist/react-dom.min.js"></script> <script src="https://a.alipayobjects.com/g/datavis/g2/2.3.13/g2.js"></script> <script src="https://unpkg.com/g2-react@1.2.0/dist/index.js"></script> <script src="https://cdn.bootcss.com/babel-core/5.8.38/browser.min.js"></script> <script src="https://unpkg.com/axios/dist/axios.min.js"></script> </head> <body> <div id="c1"></div> <script type="text/babel">undefined </body> </html>