G2
图表示例
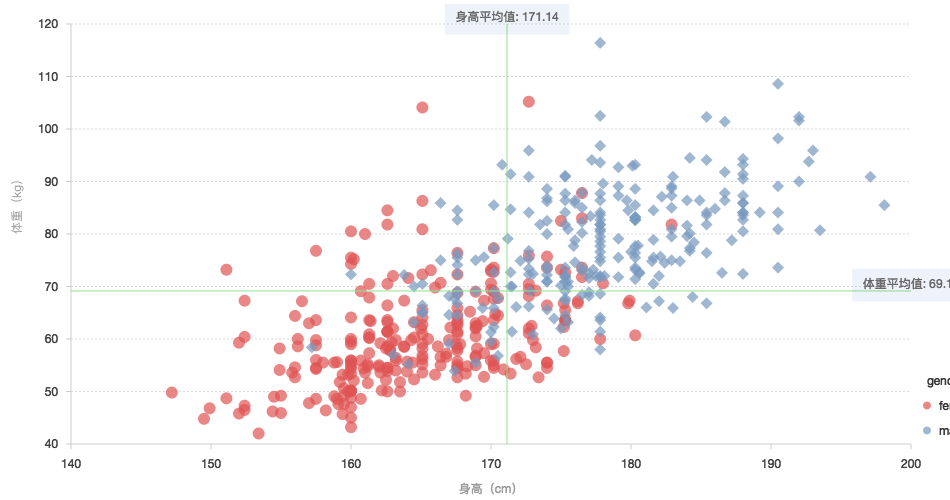
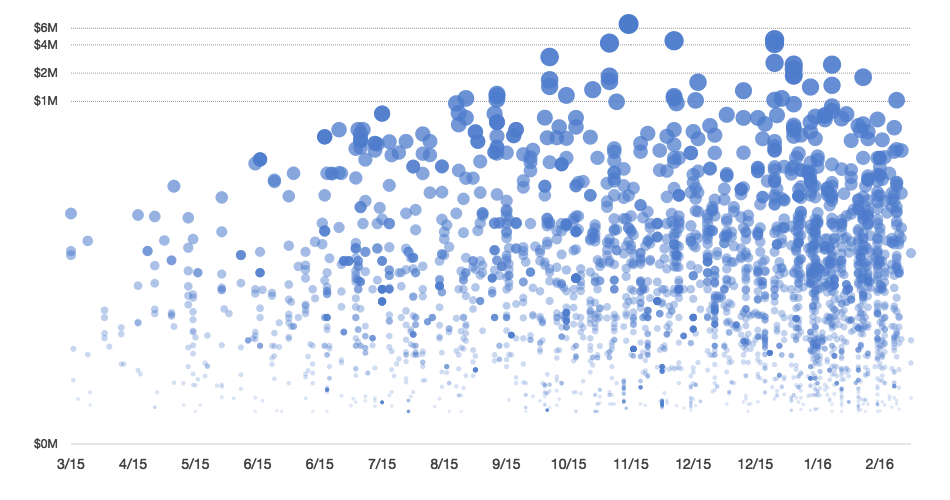
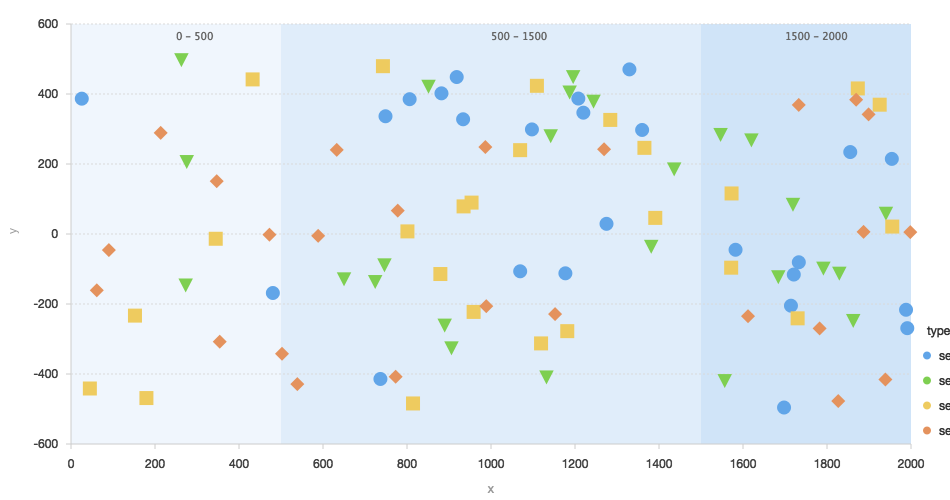
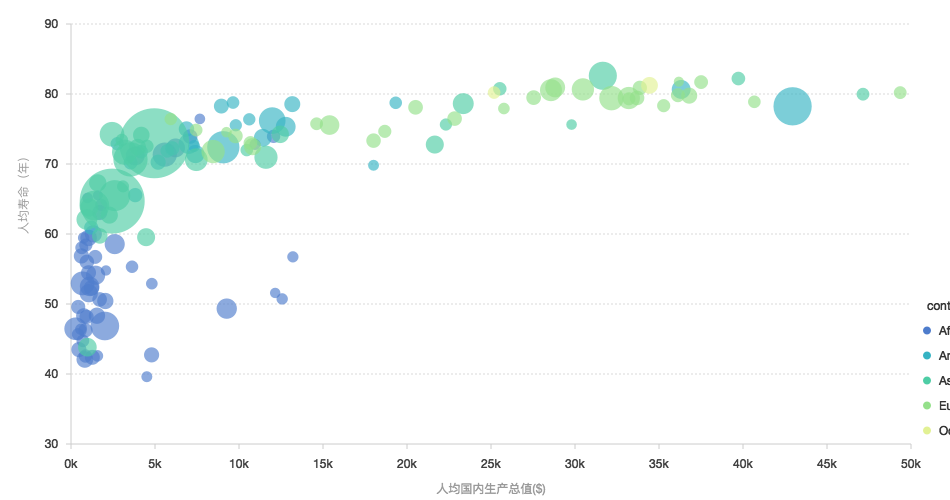
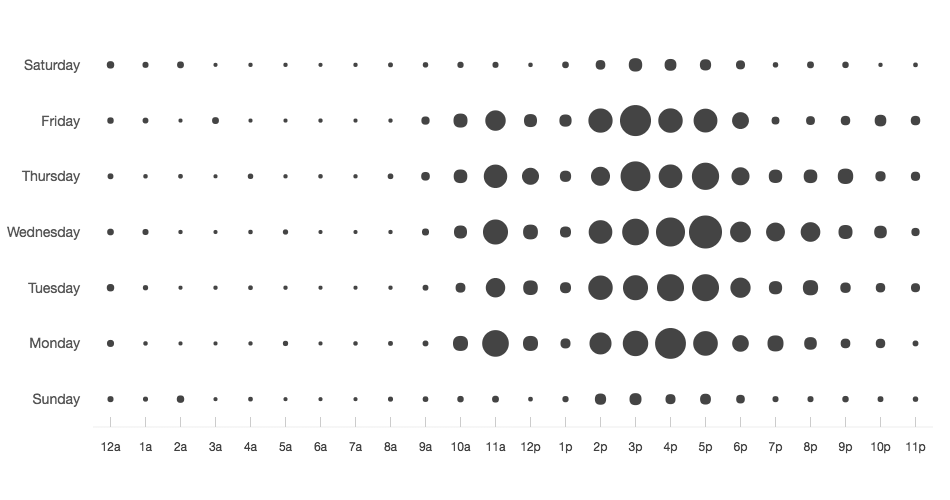
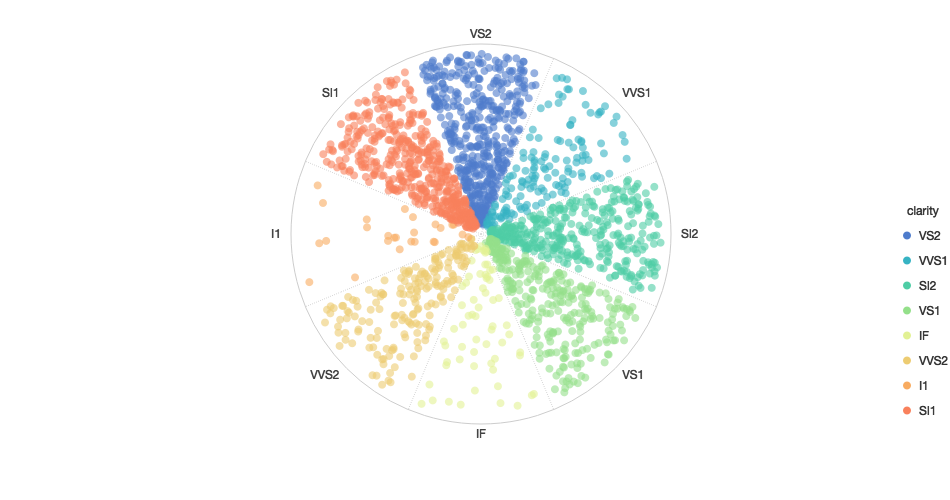
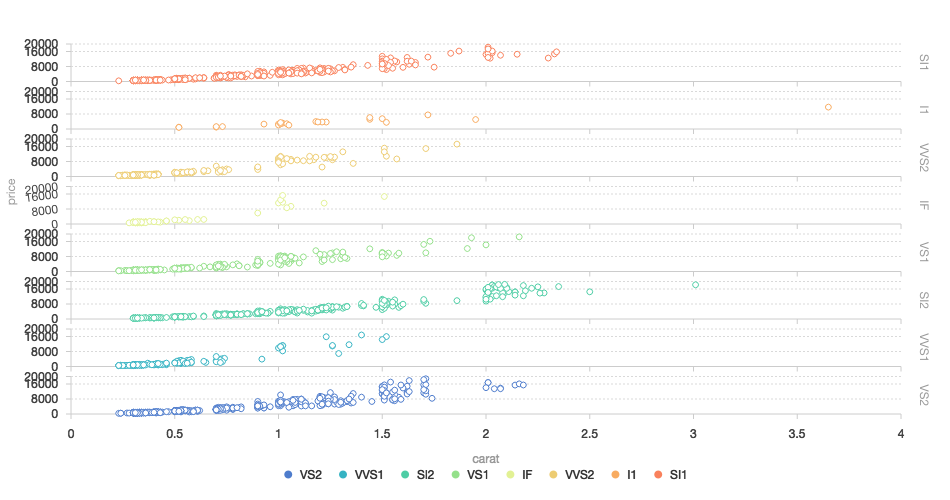
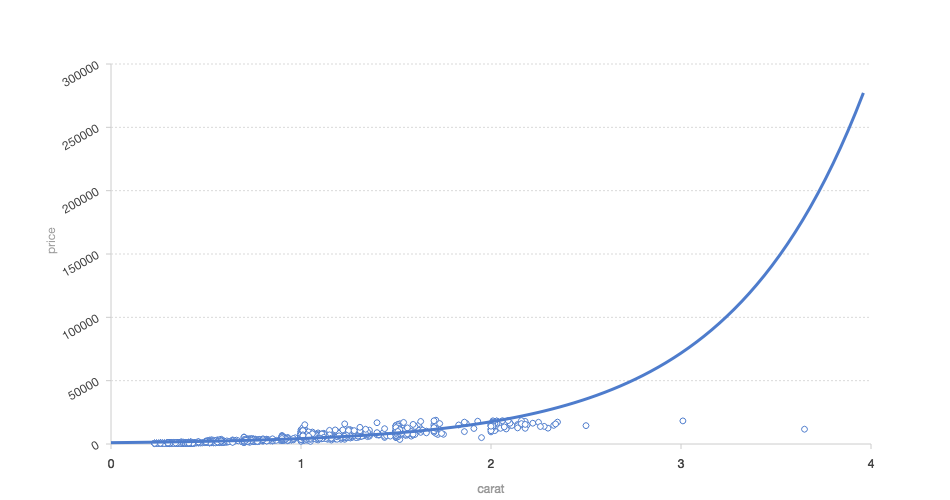
点图
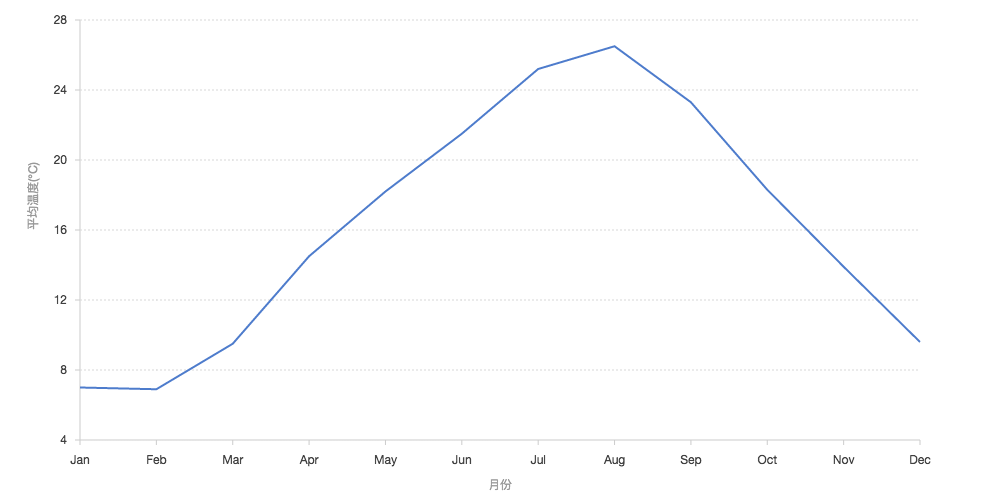
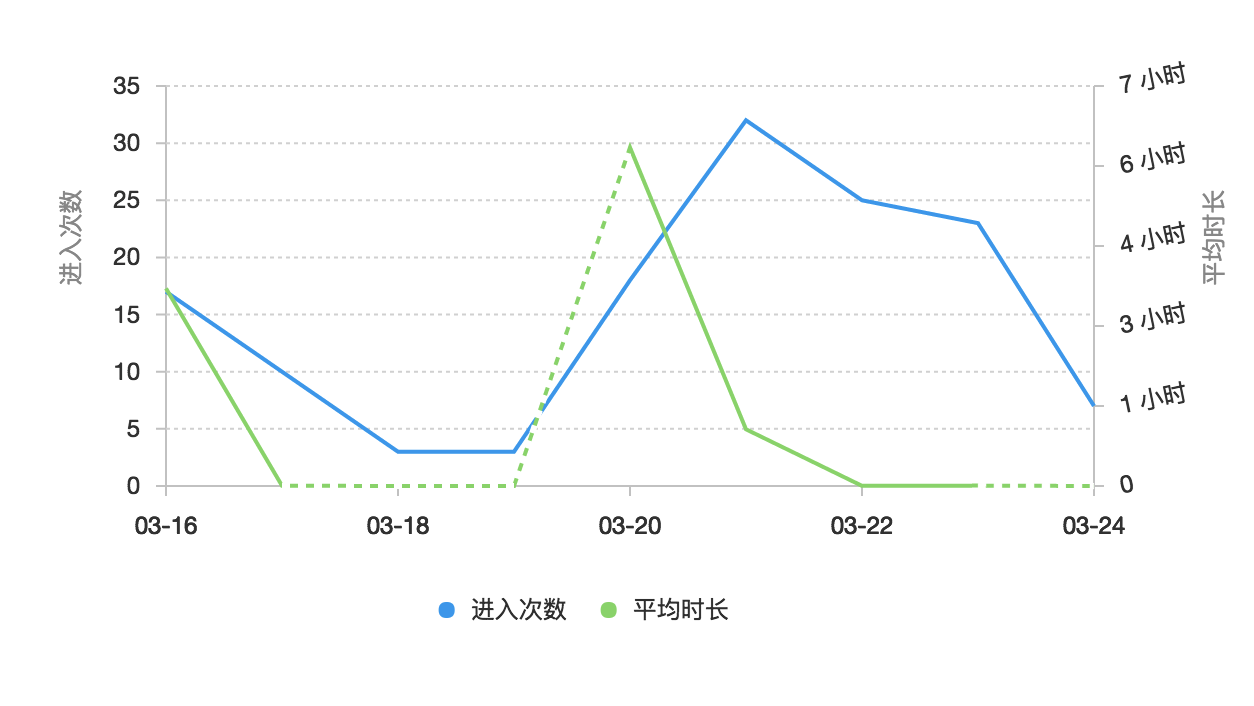
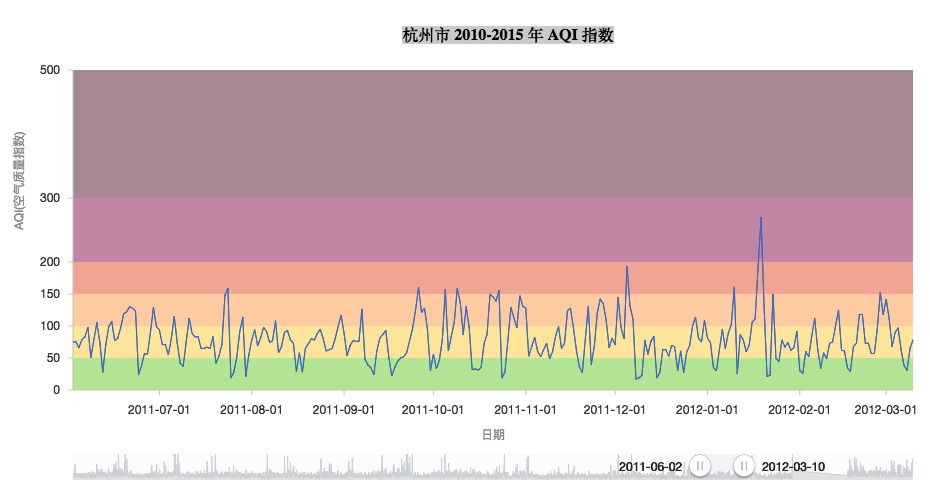
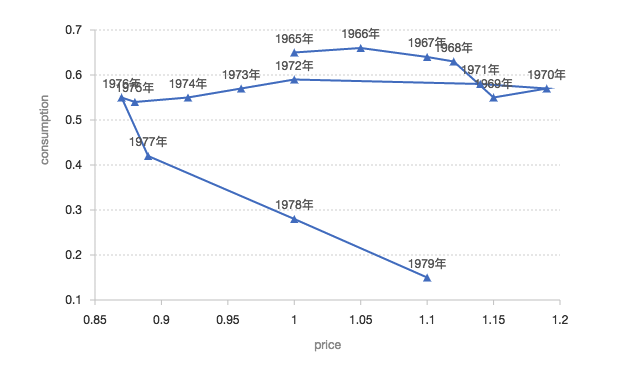
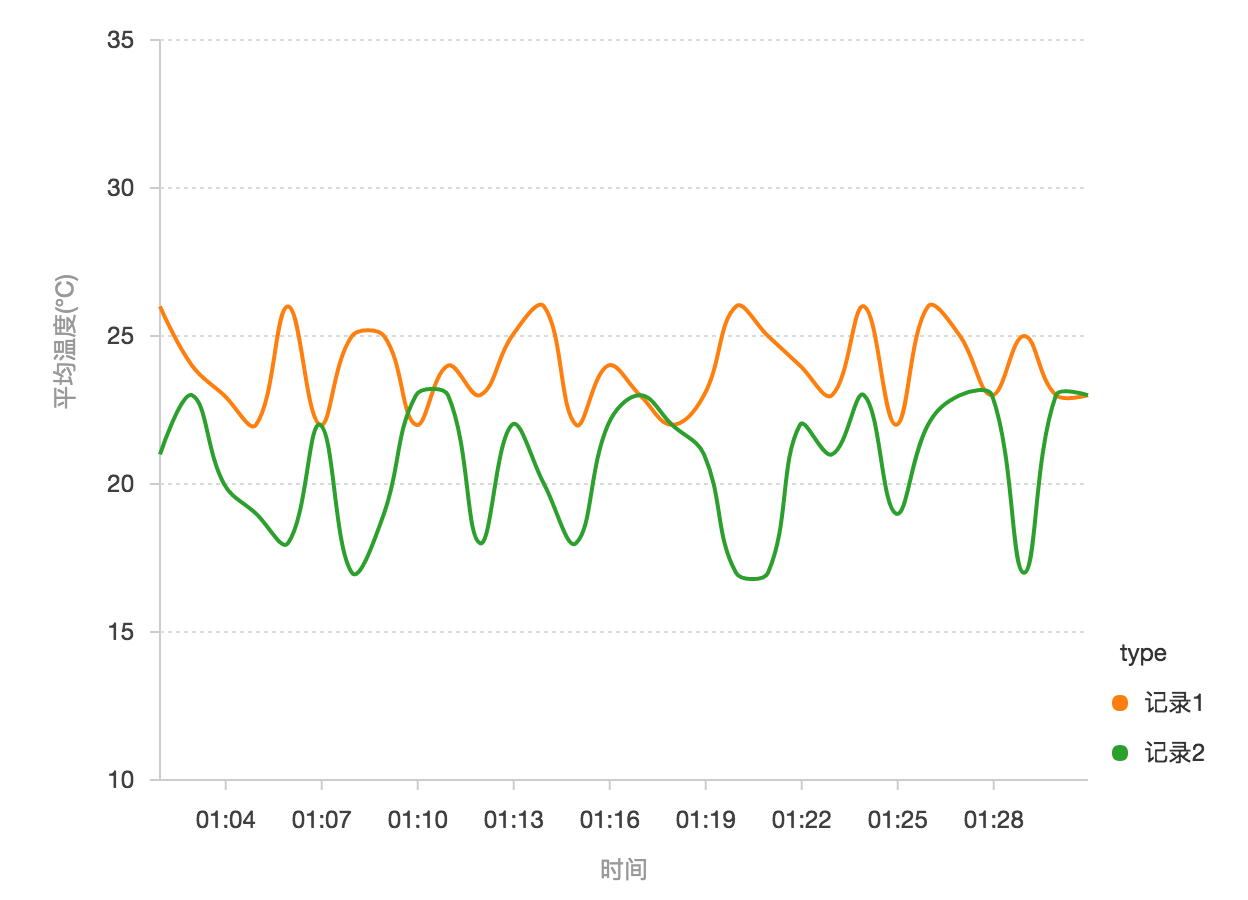
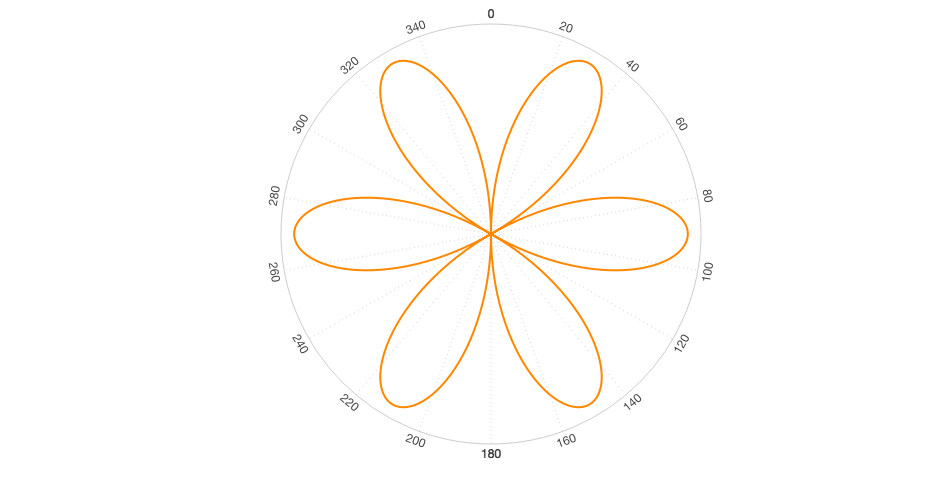
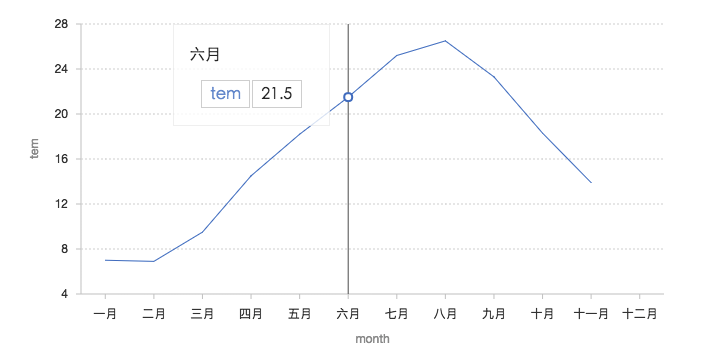
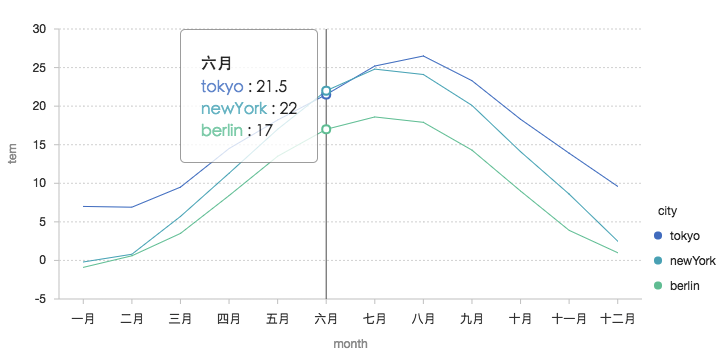
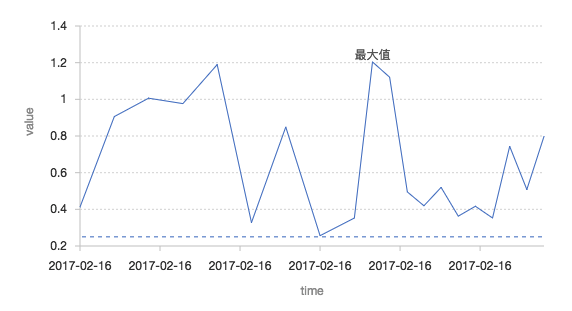
线图
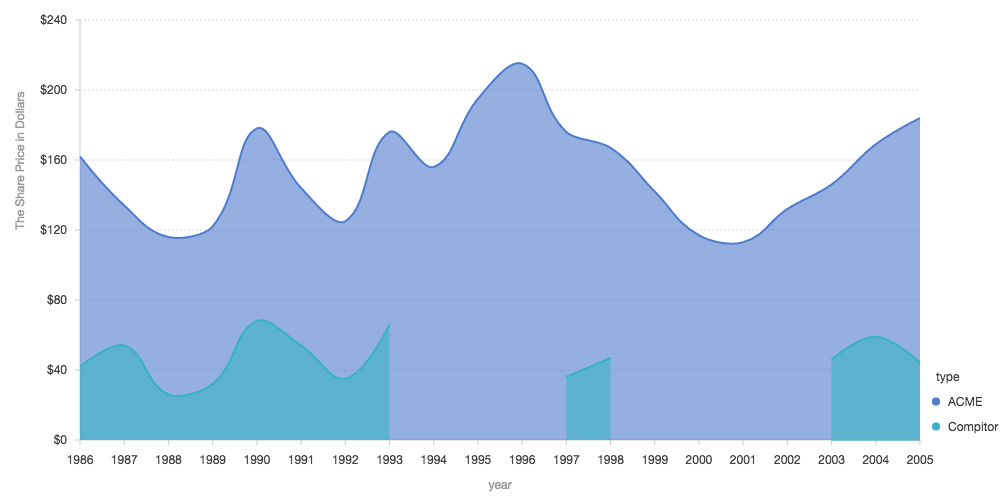
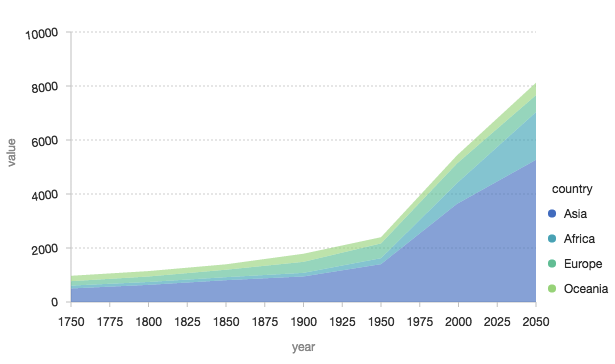
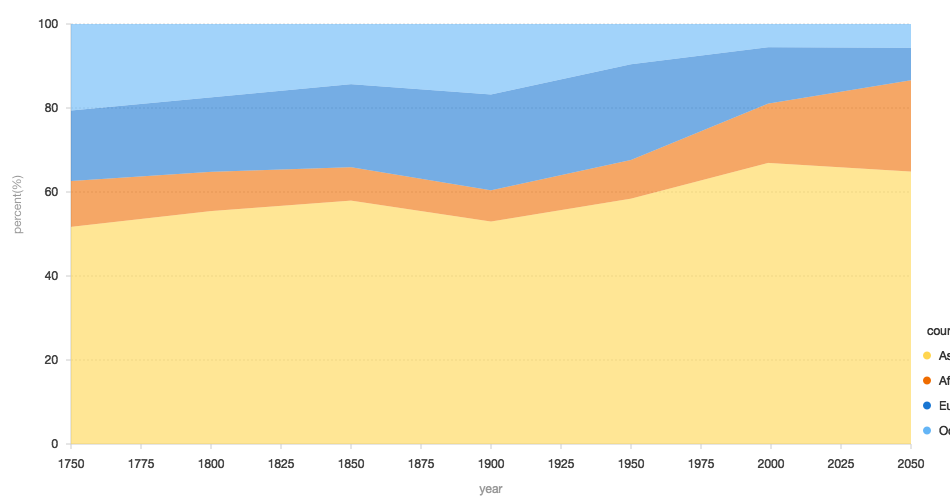
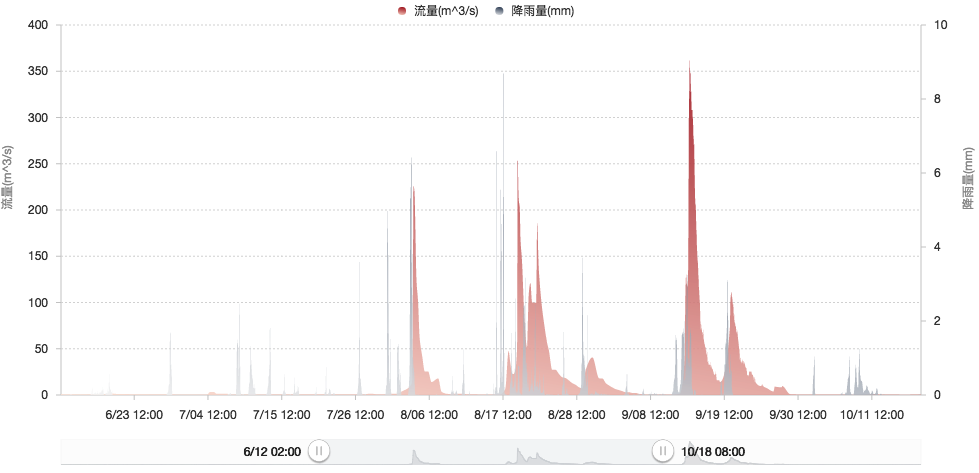
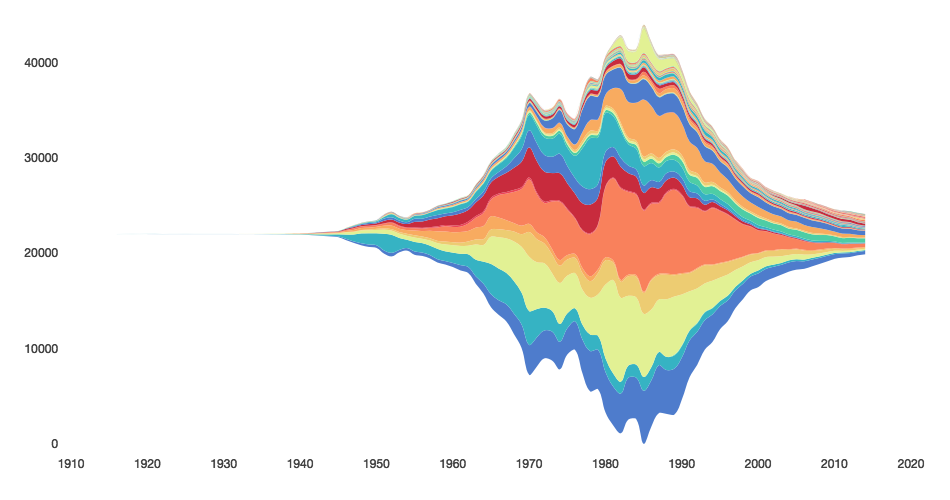
区域图
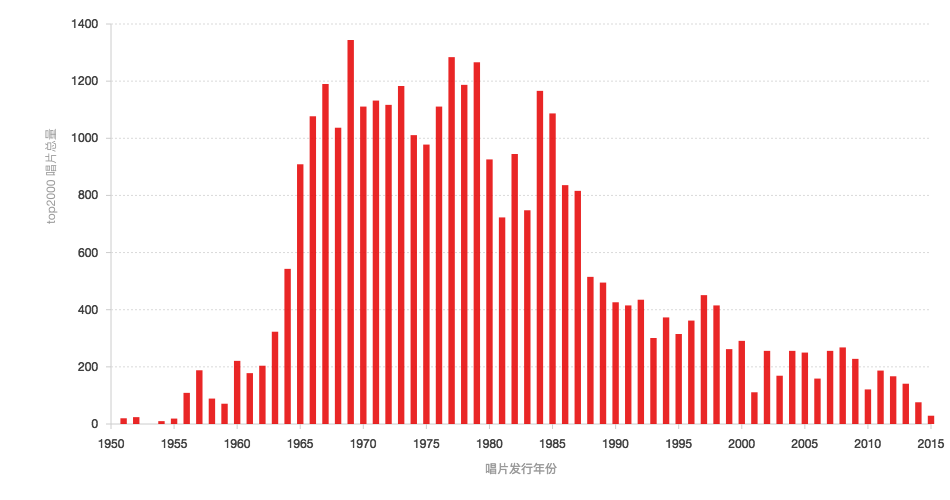
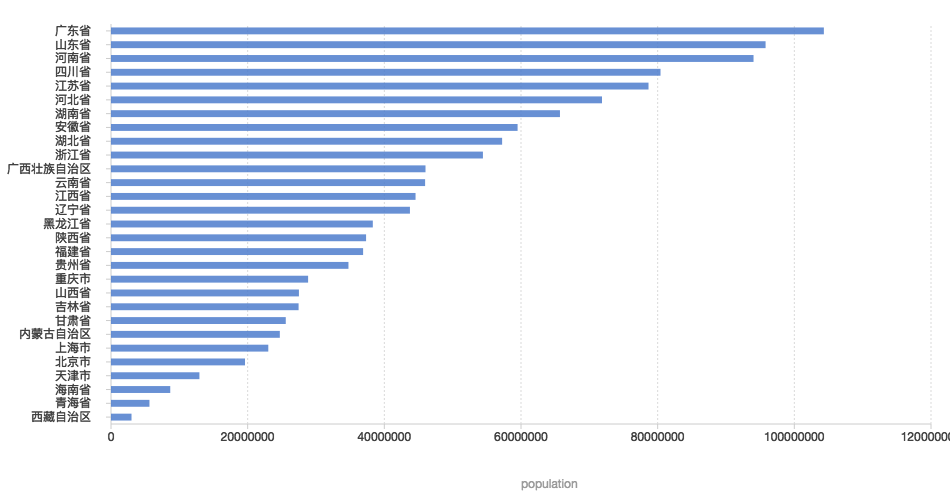
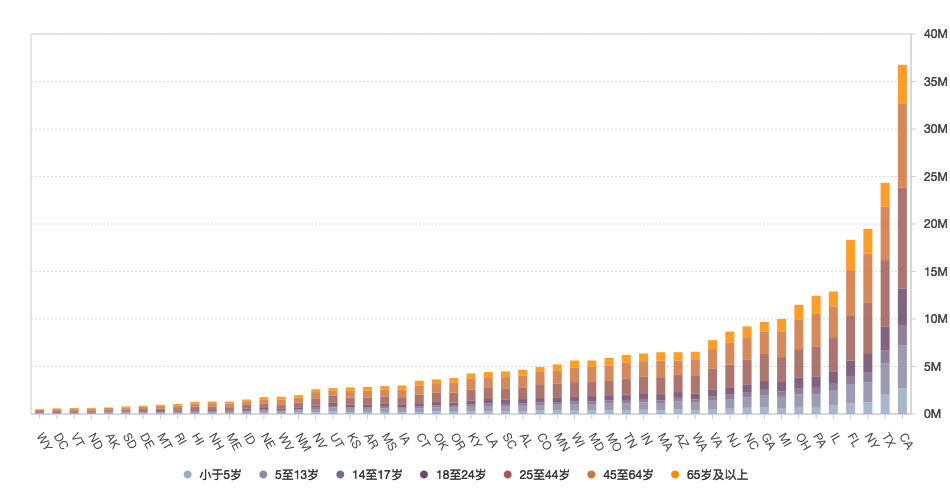
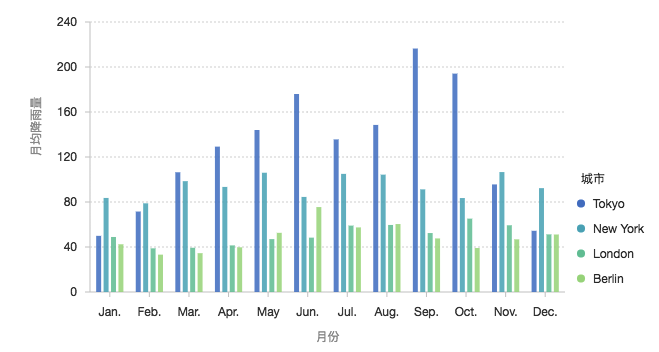
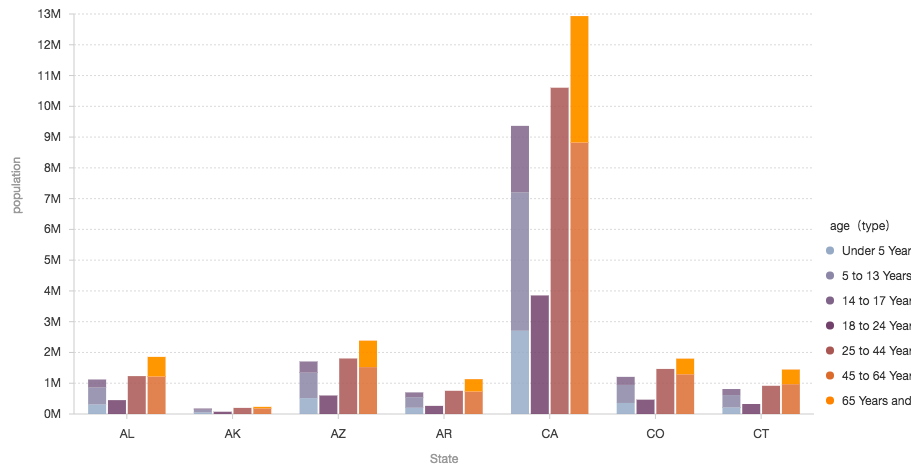
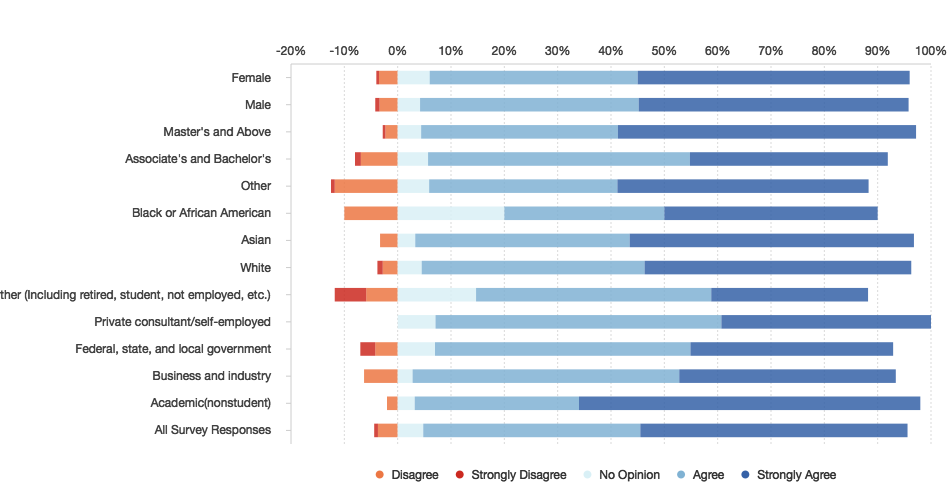
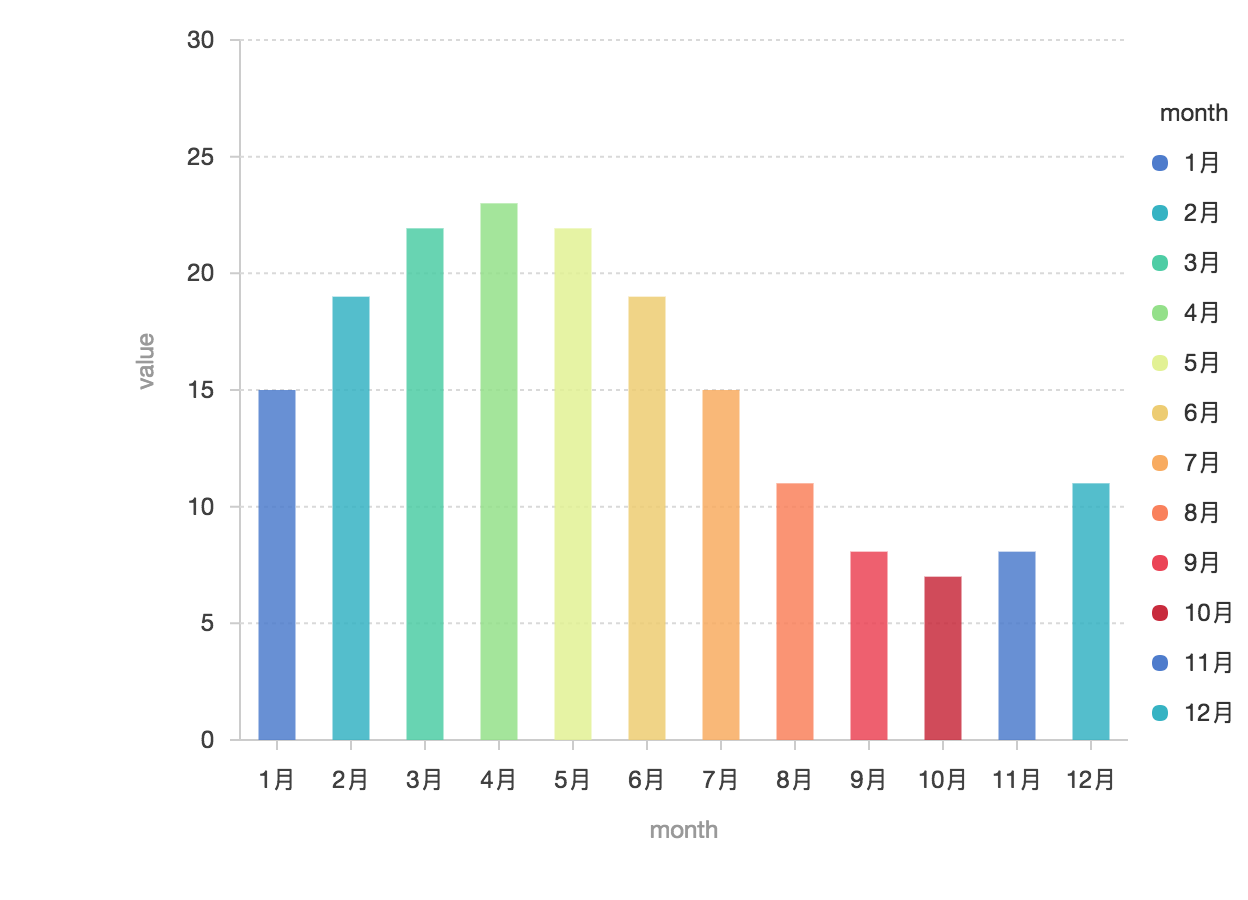
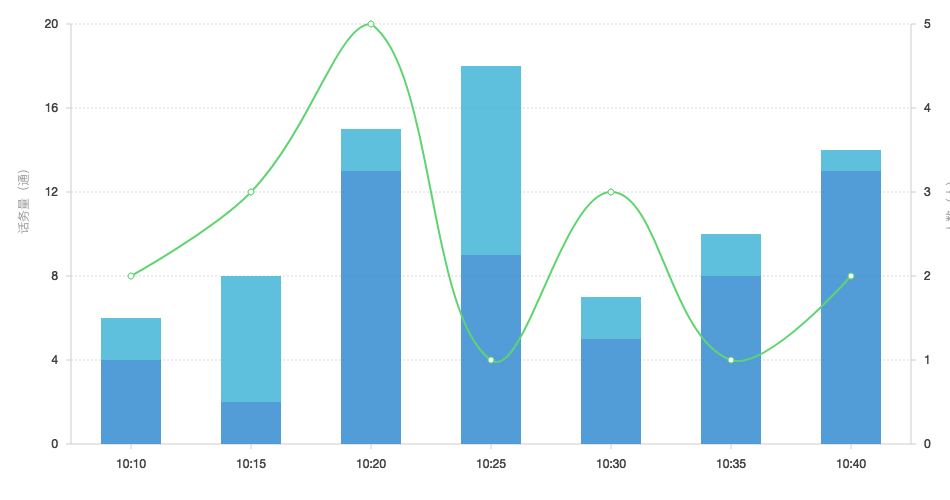
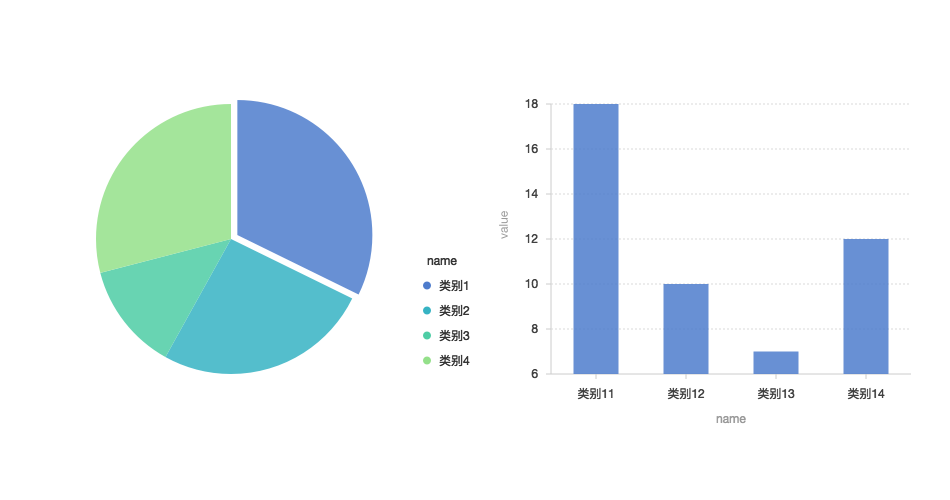
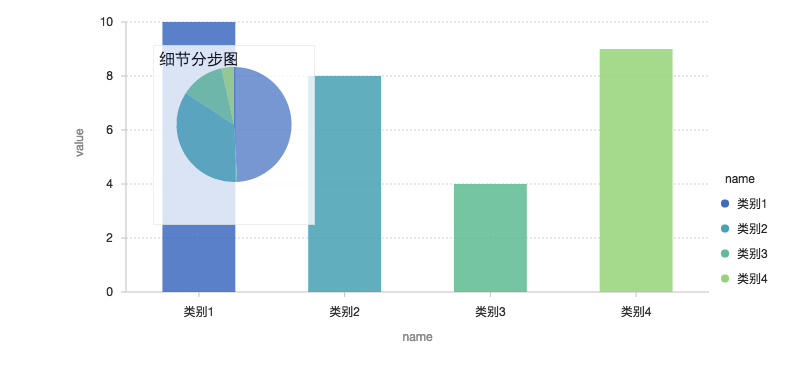
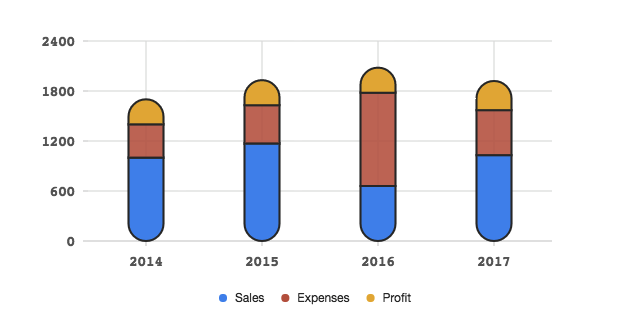
柱状图
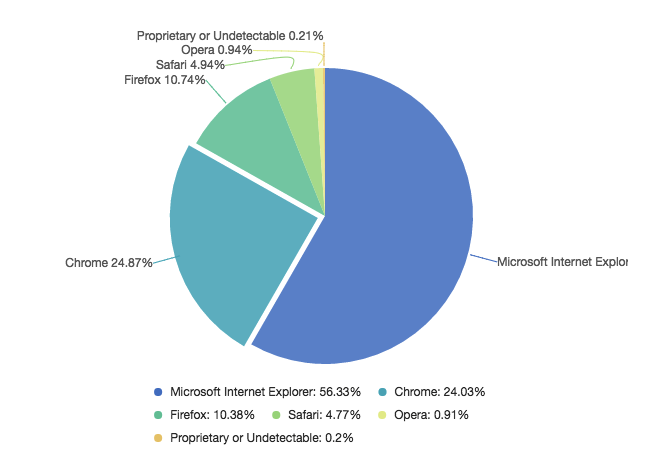
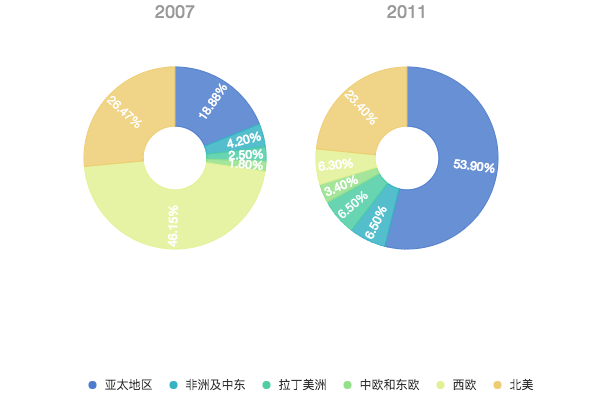
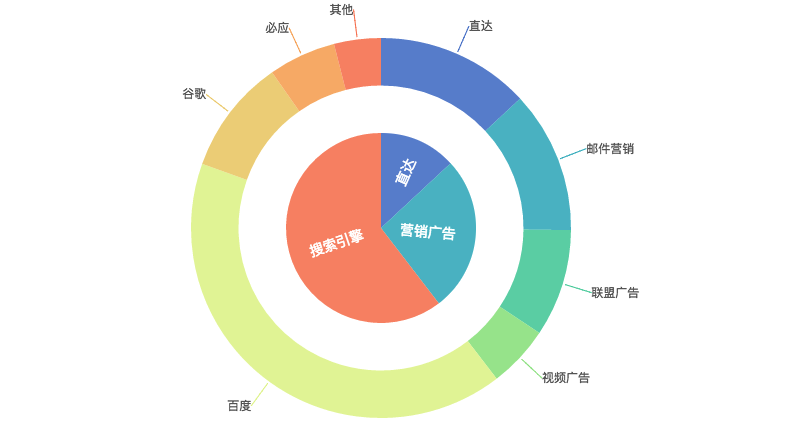
饼图
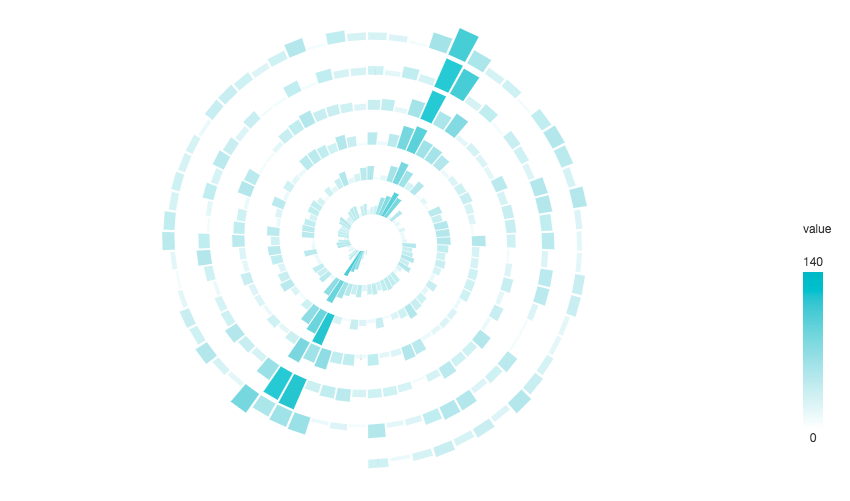
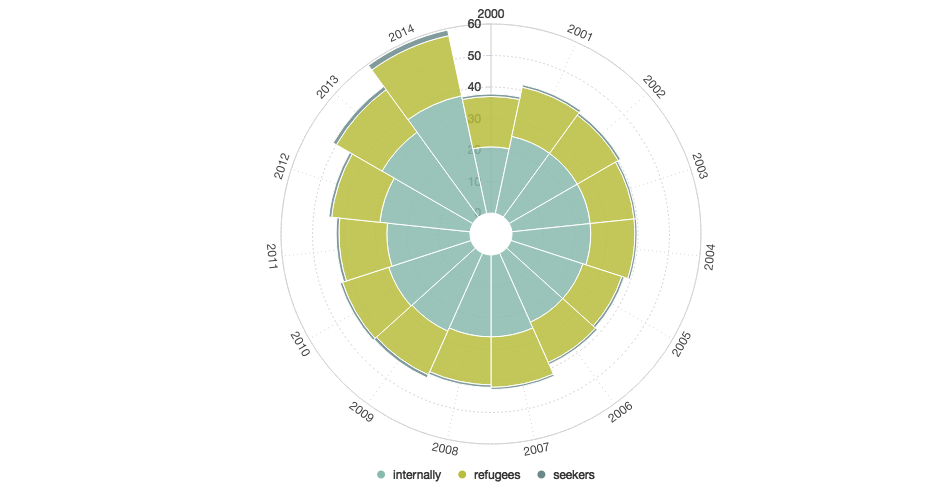
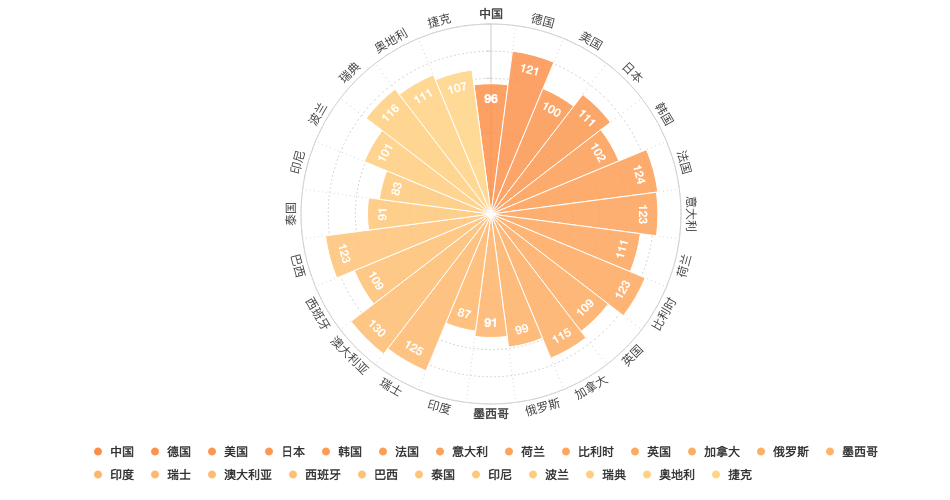
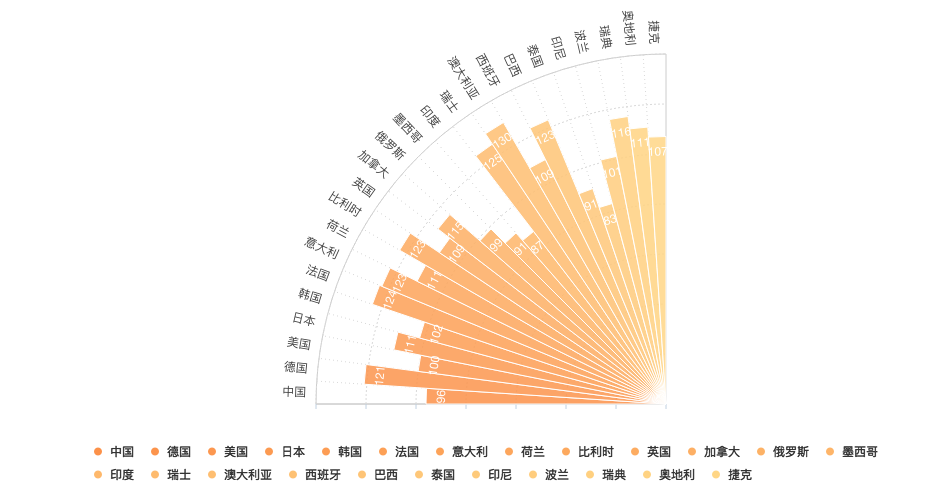
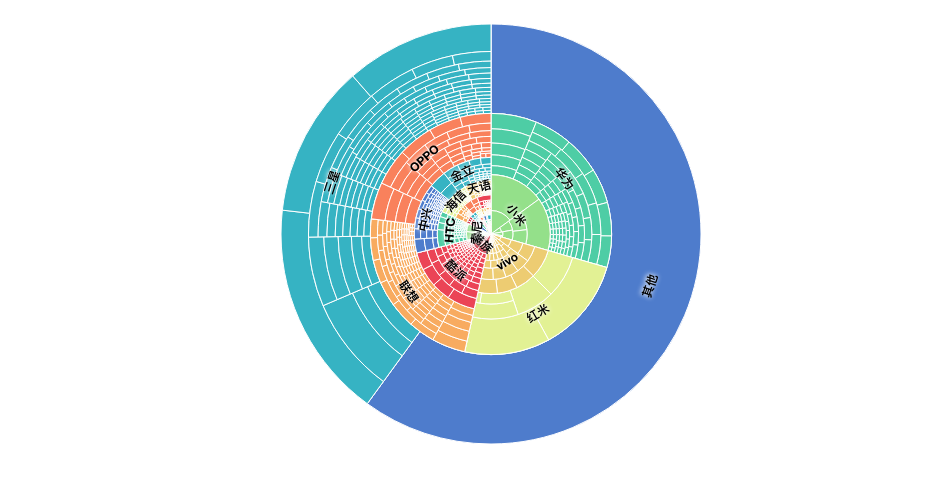
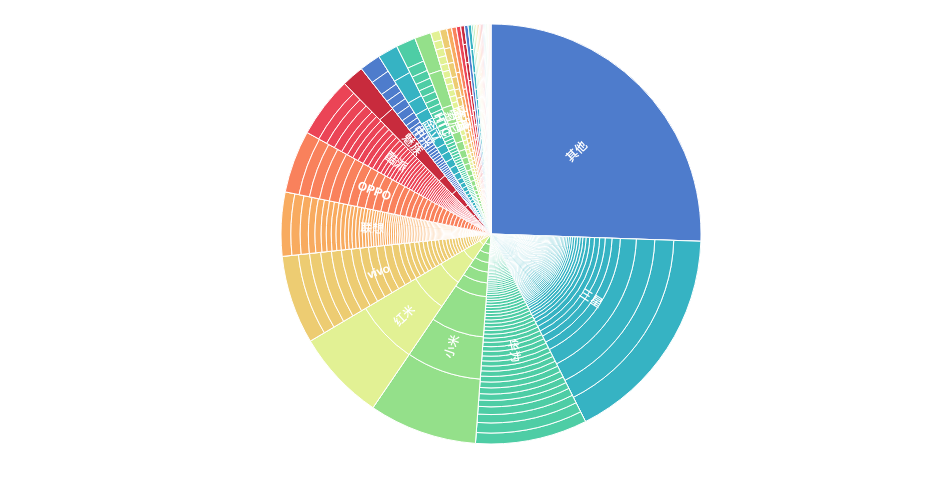
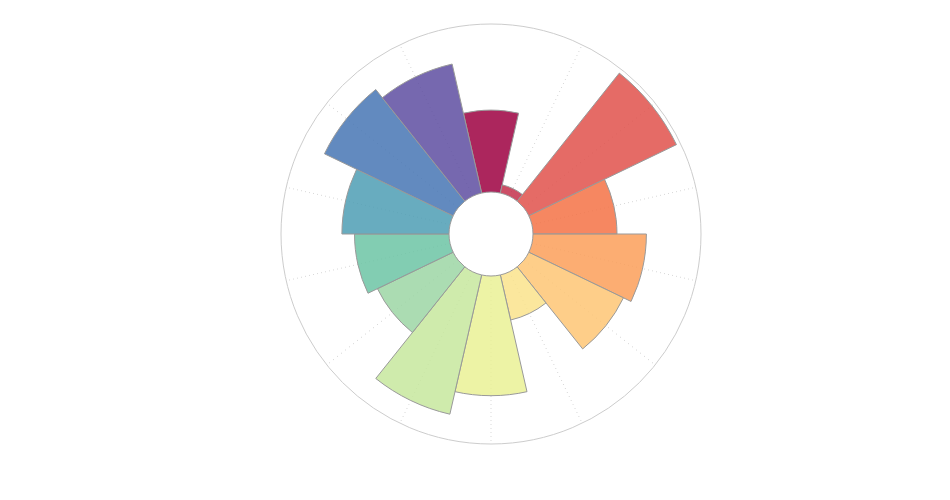
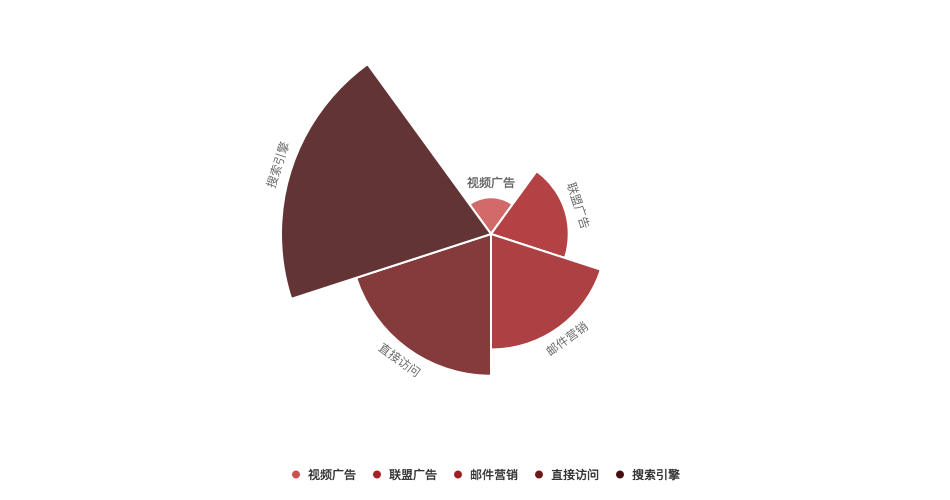
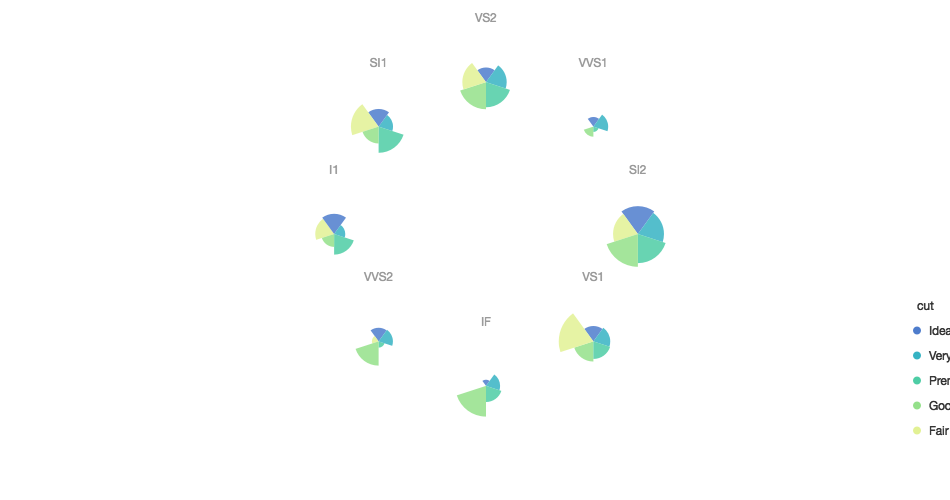
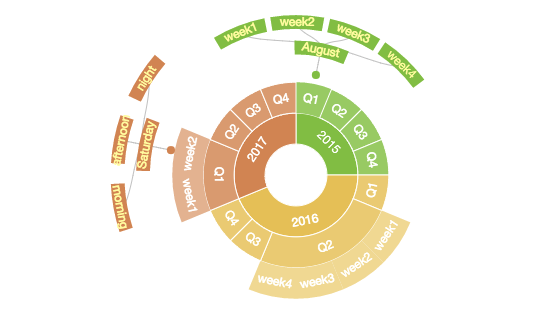
南丁格尔玫瑰图
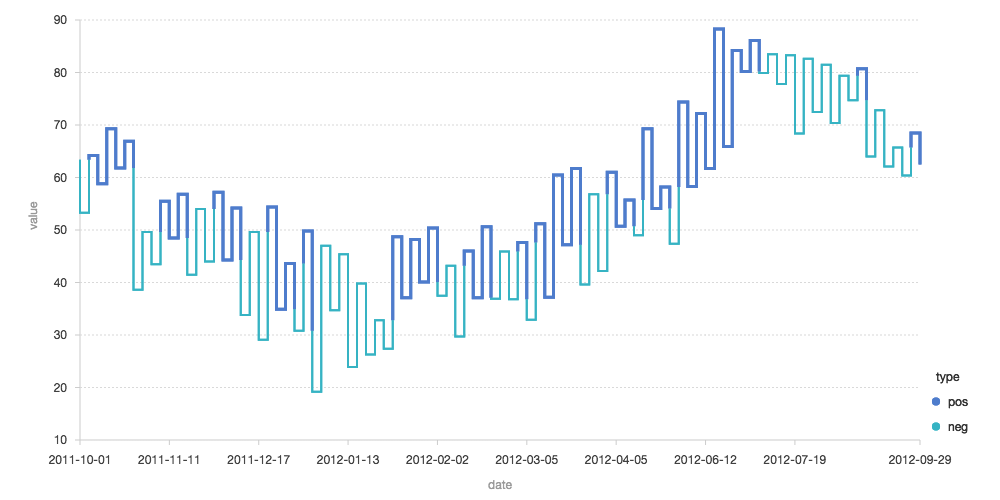
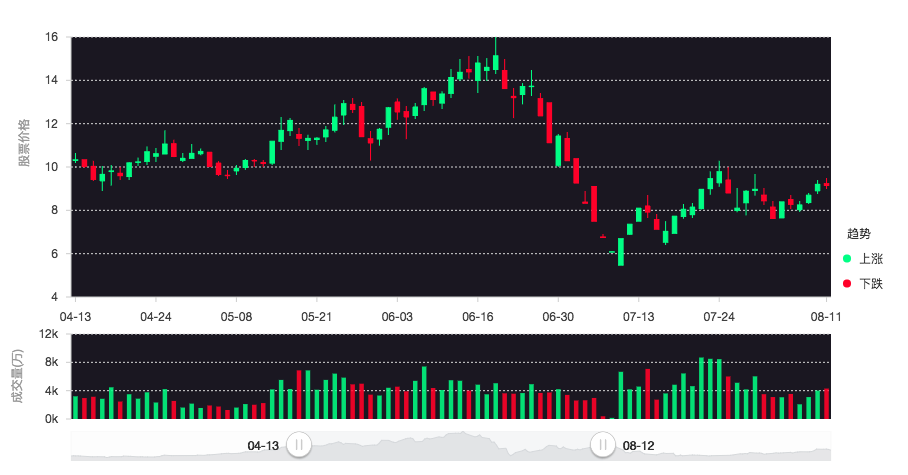
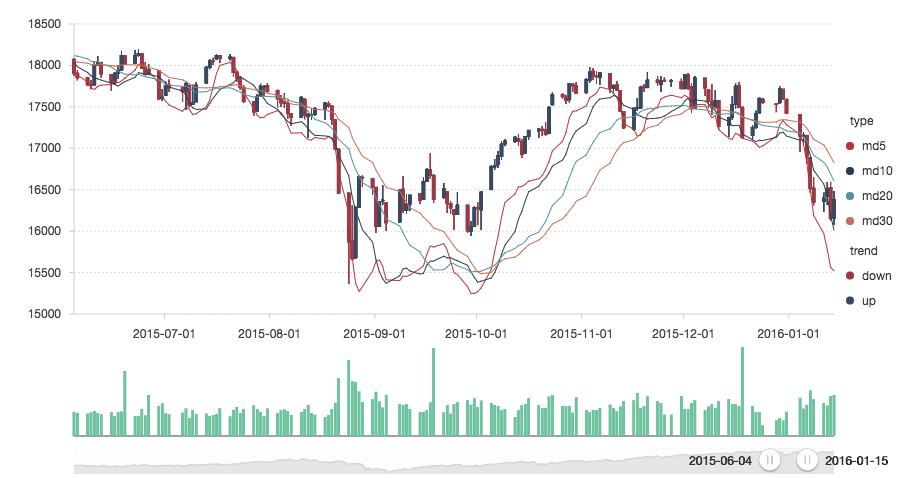
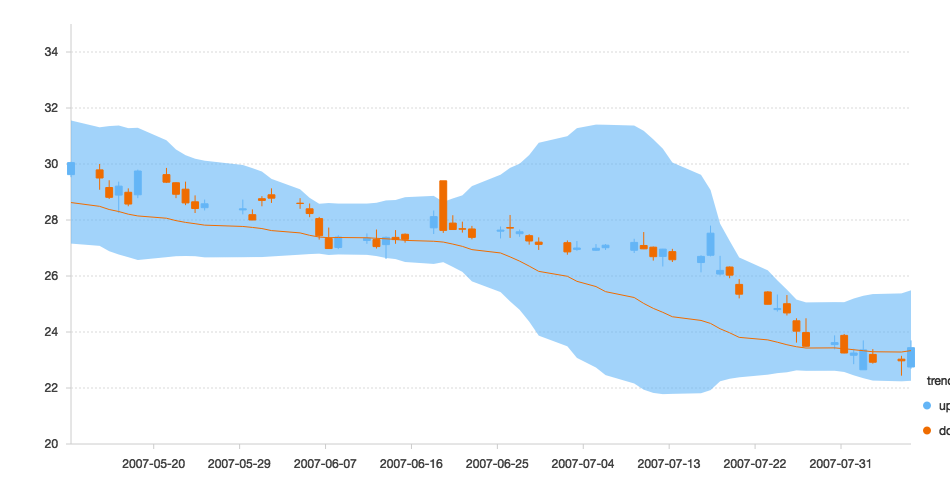
股票图
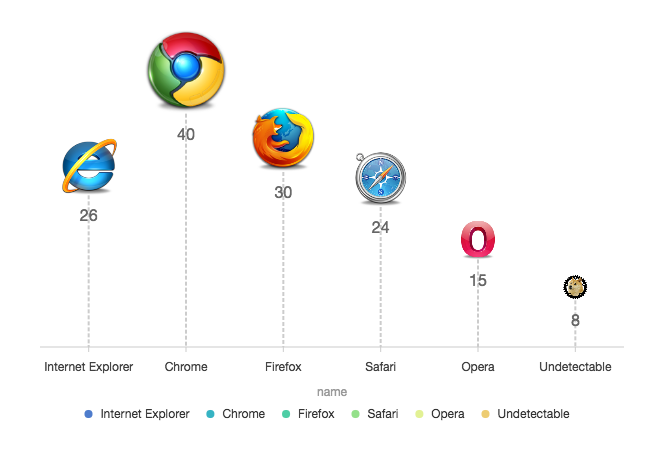
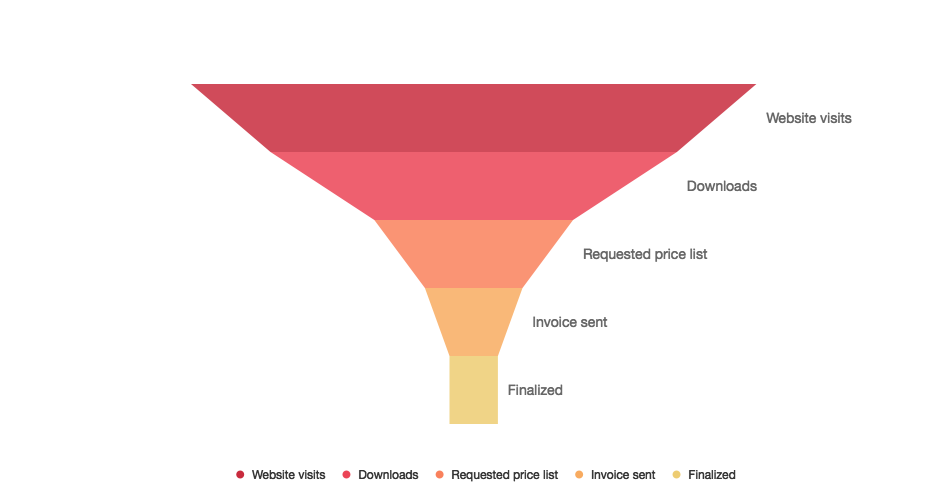
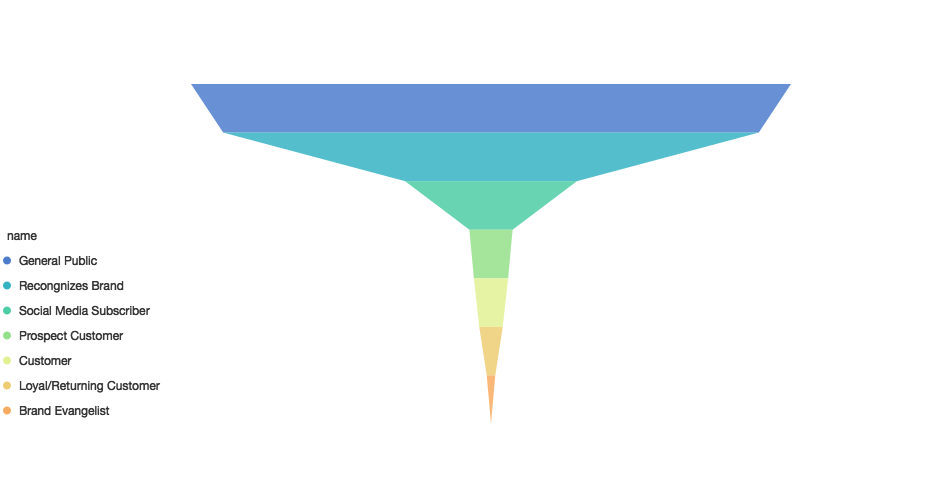
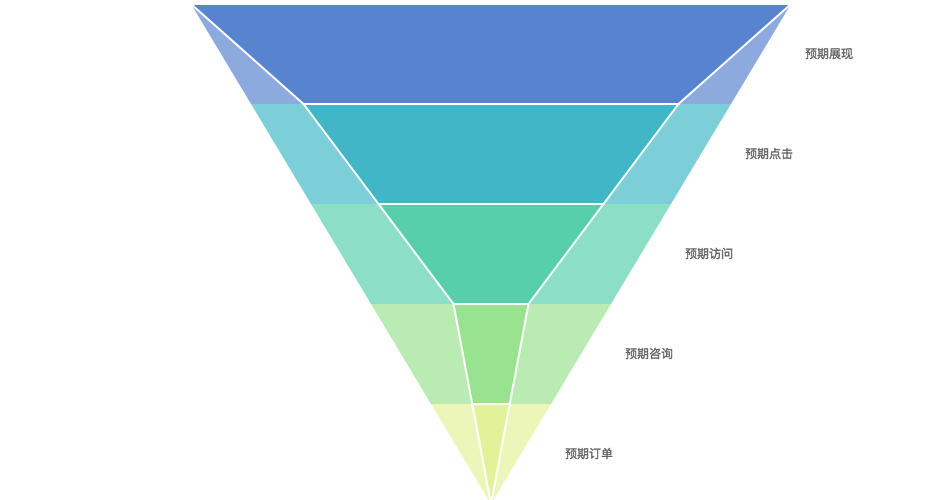
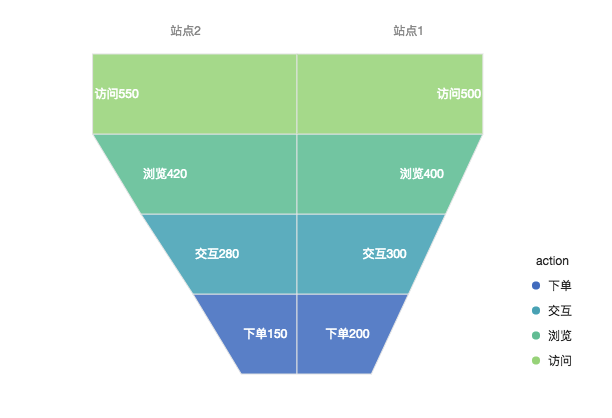
漏斗图
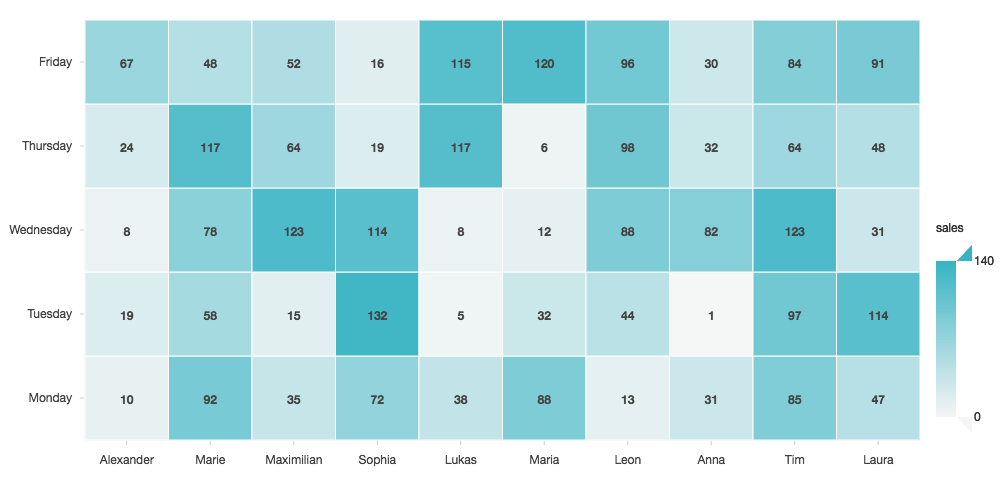
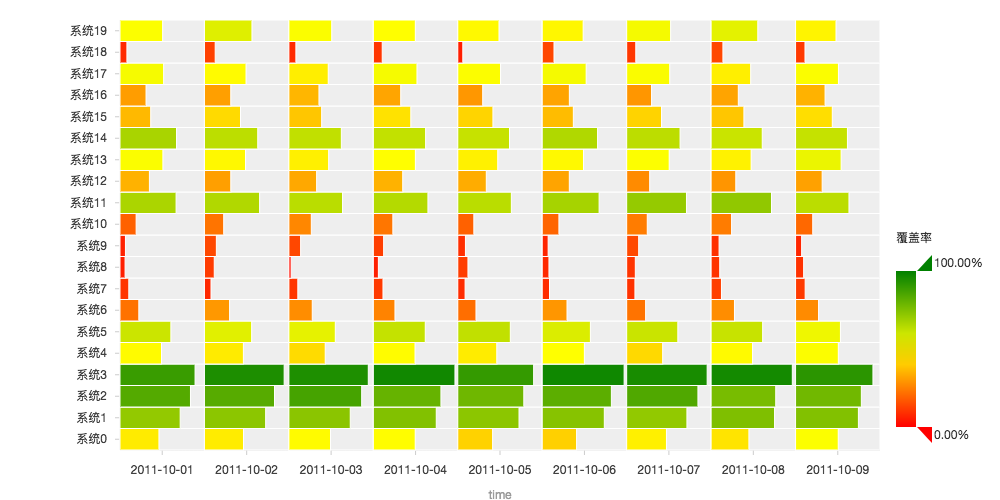
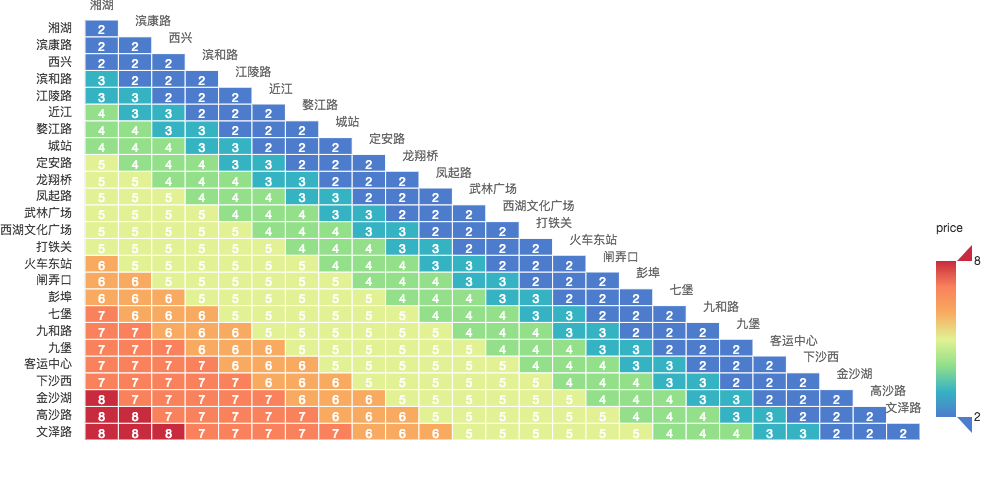
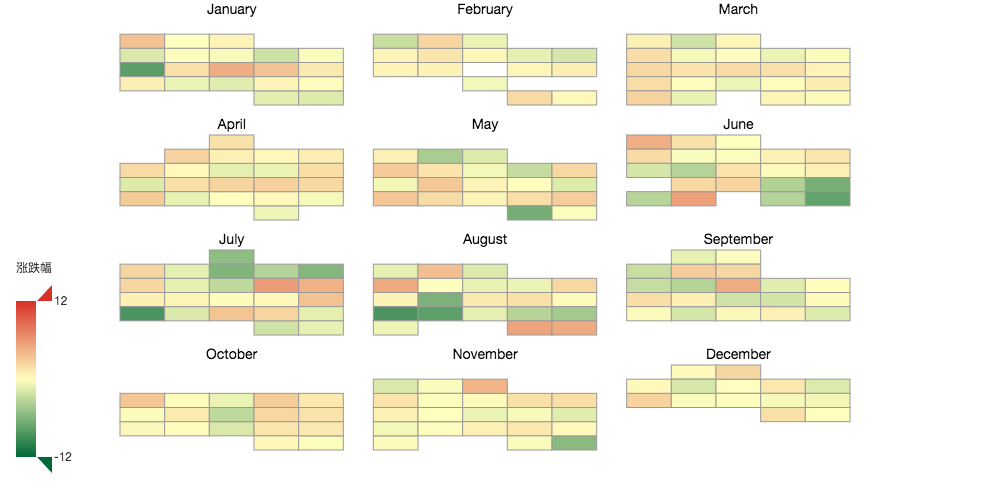
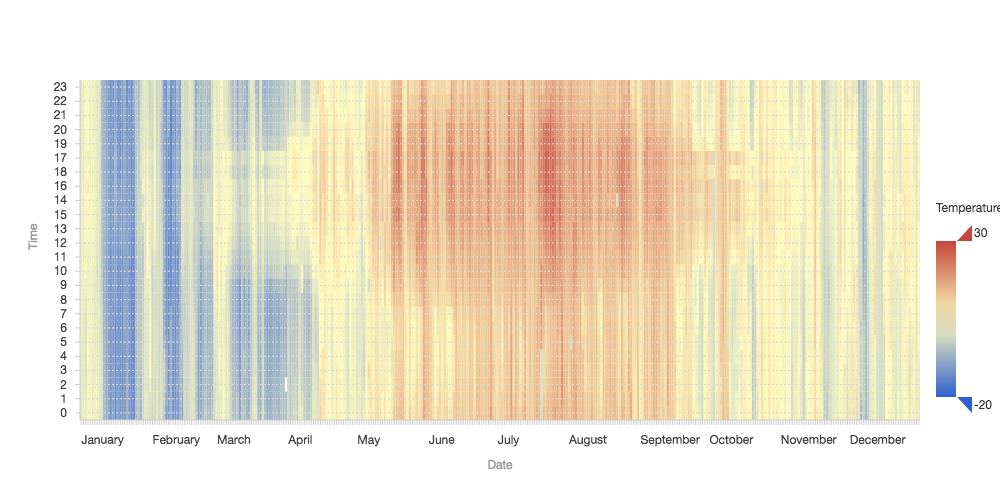
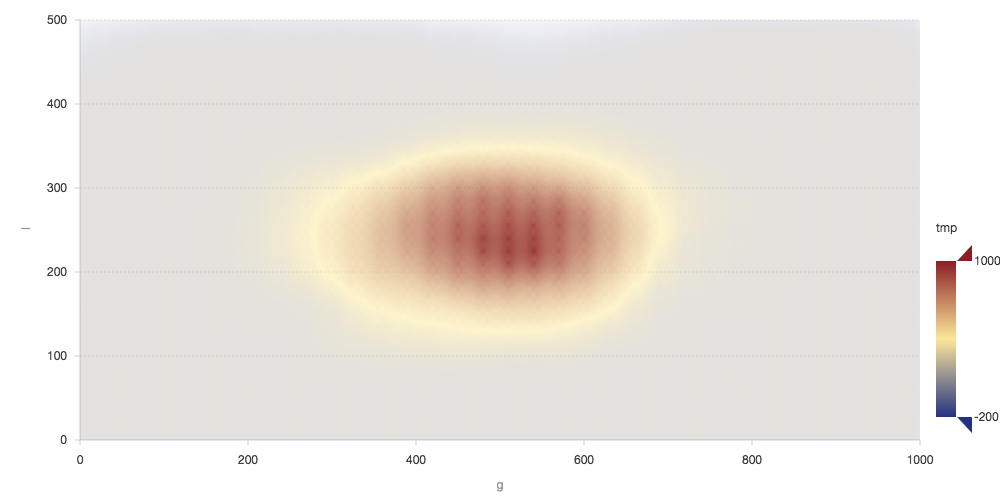
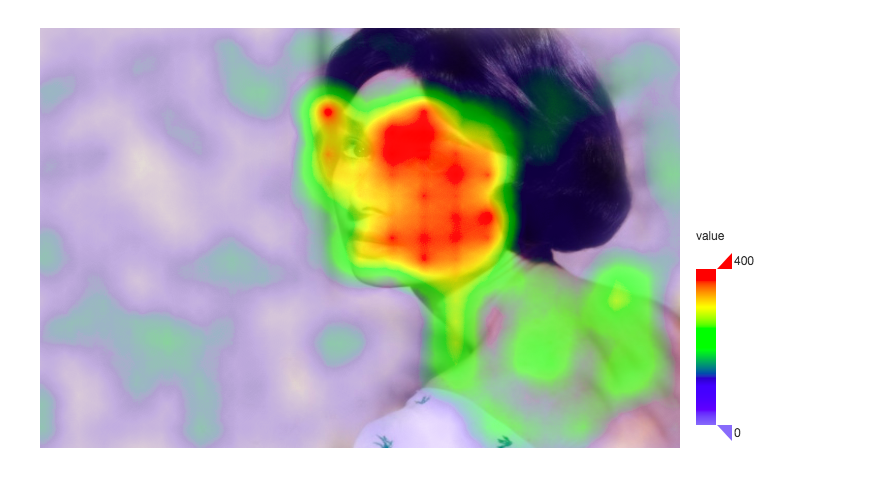
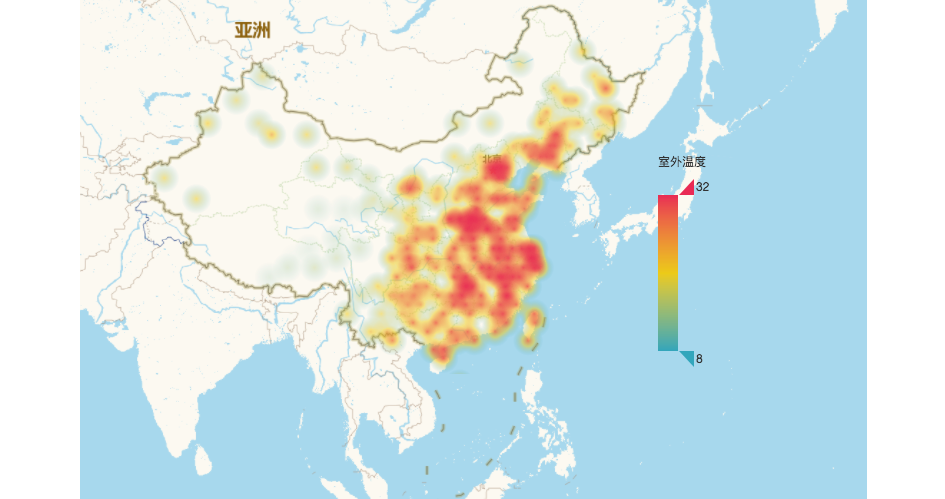
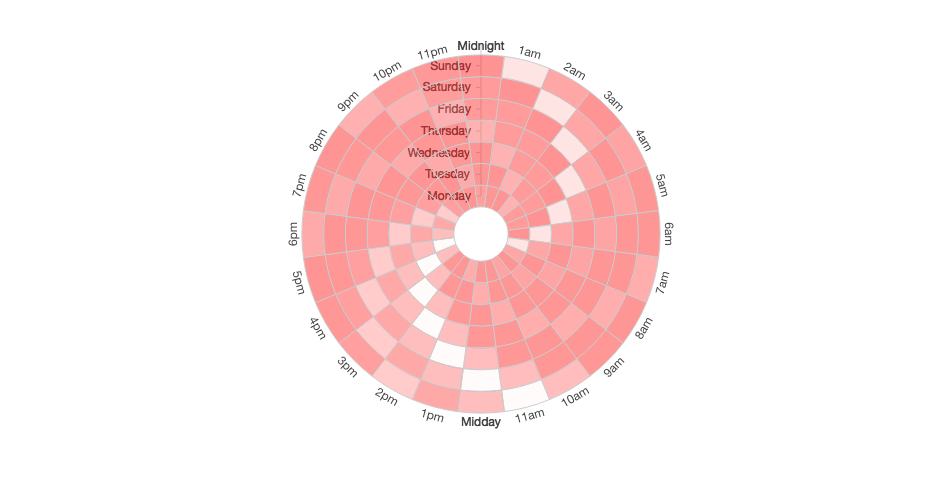
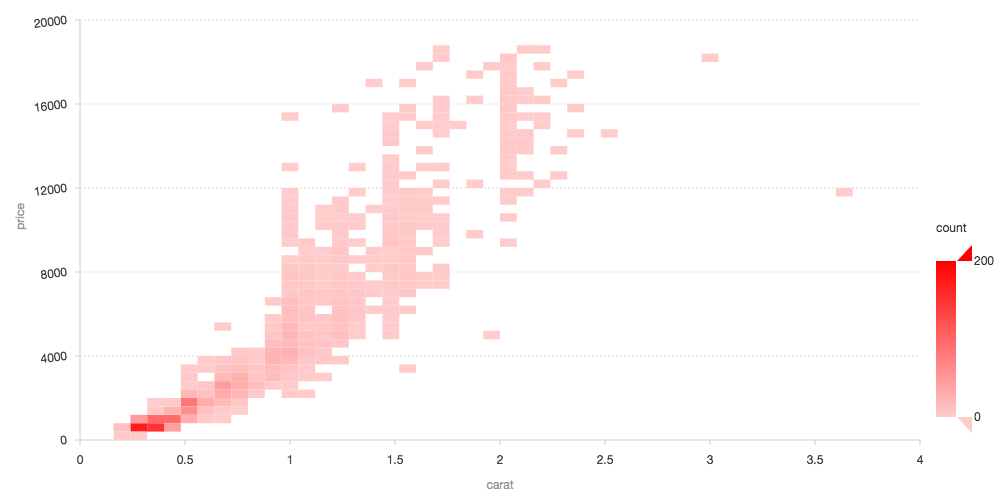
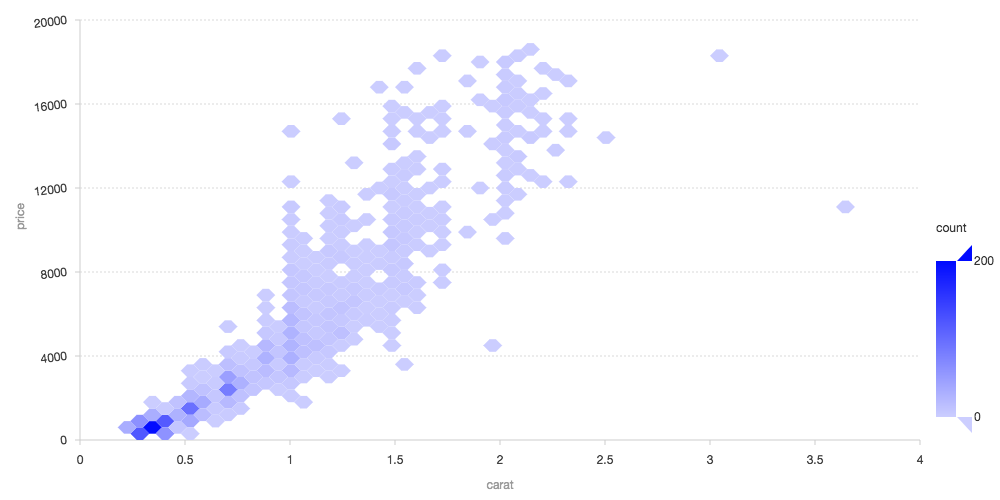
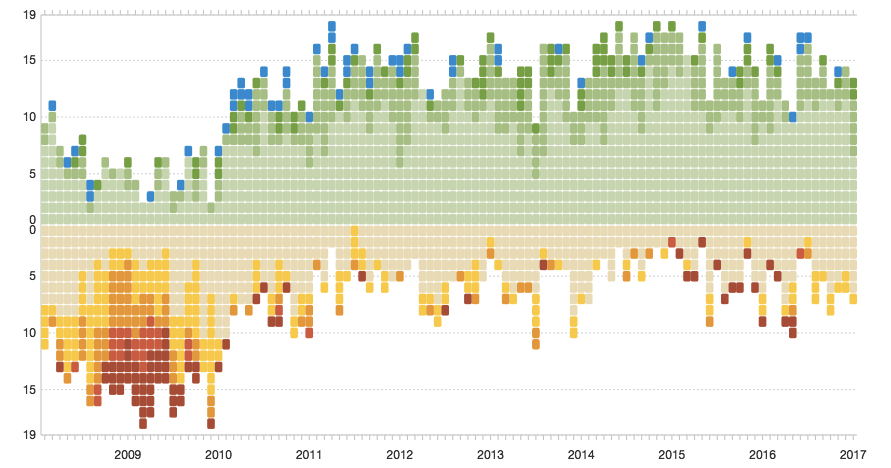
热力或色块图
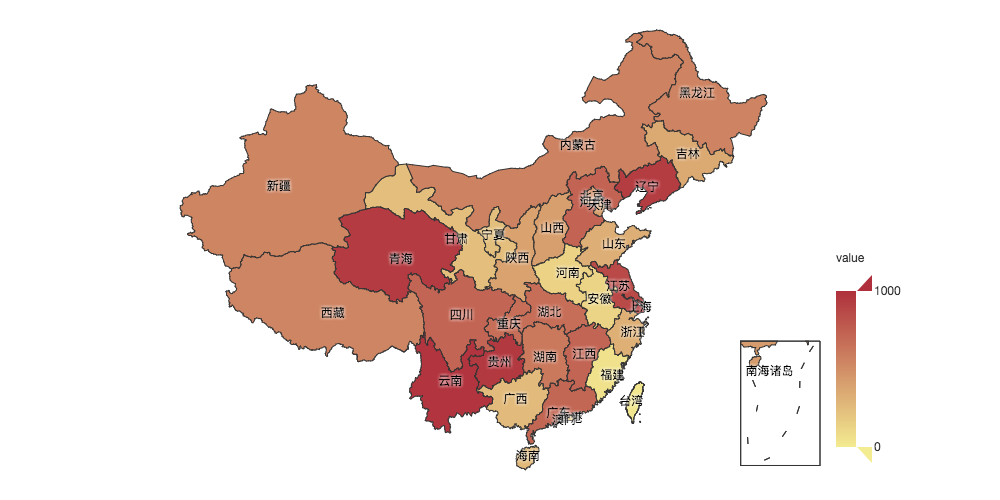
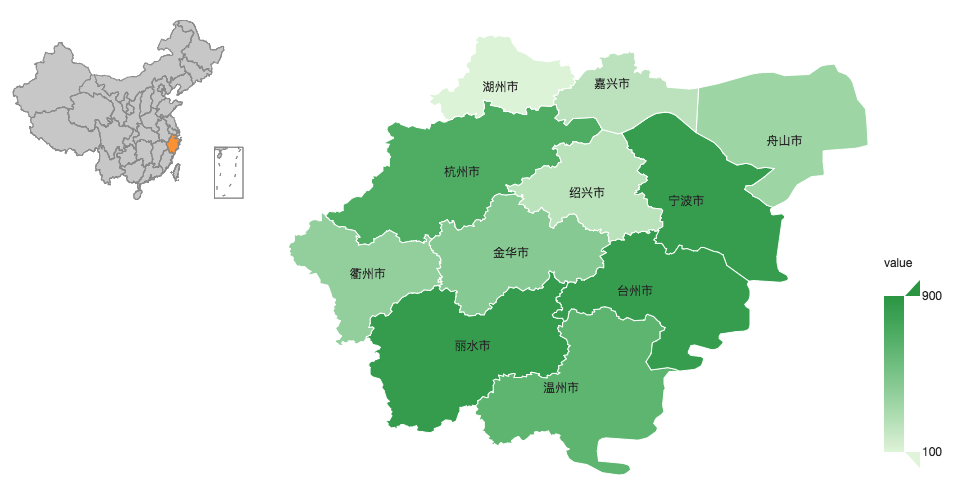
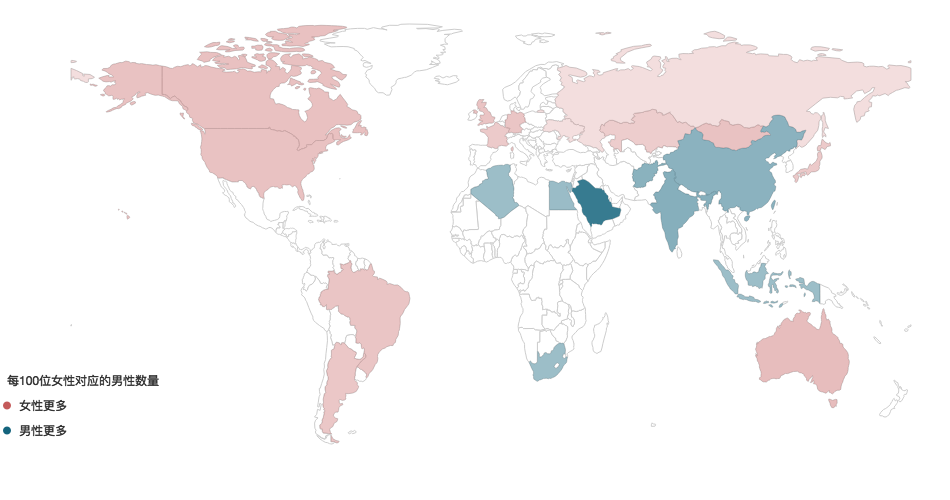
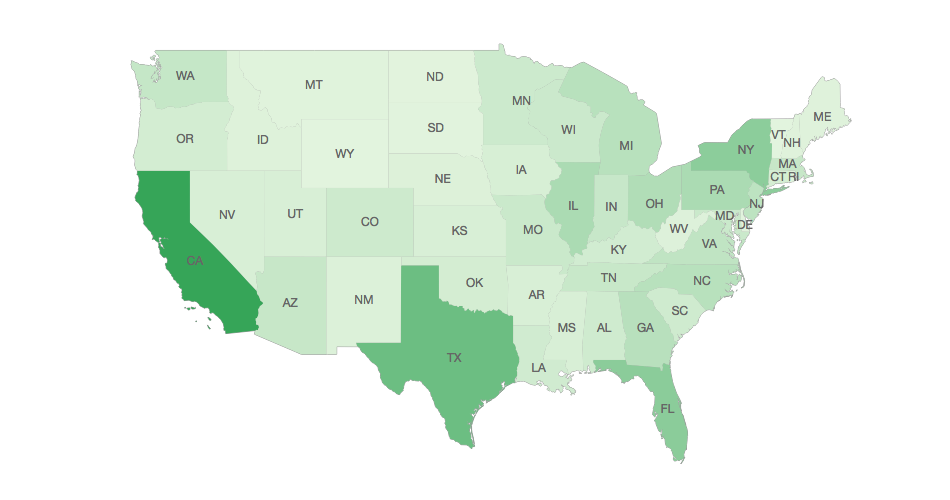
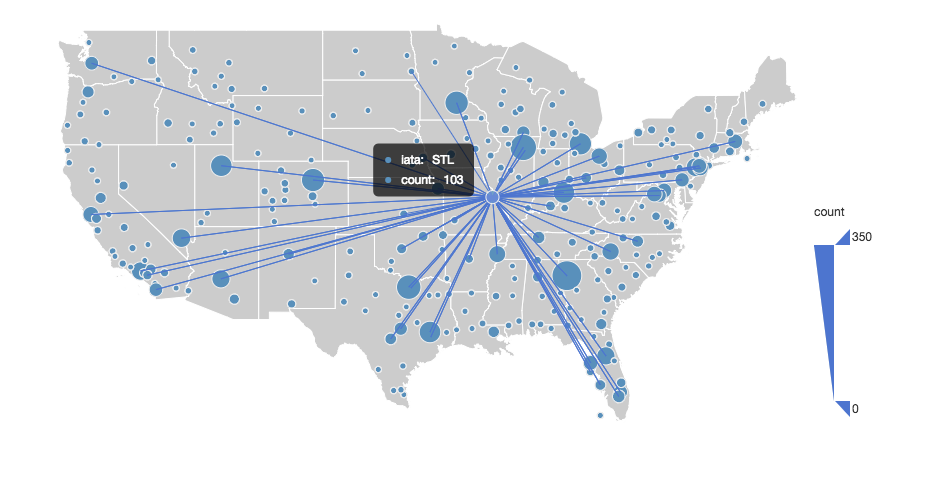
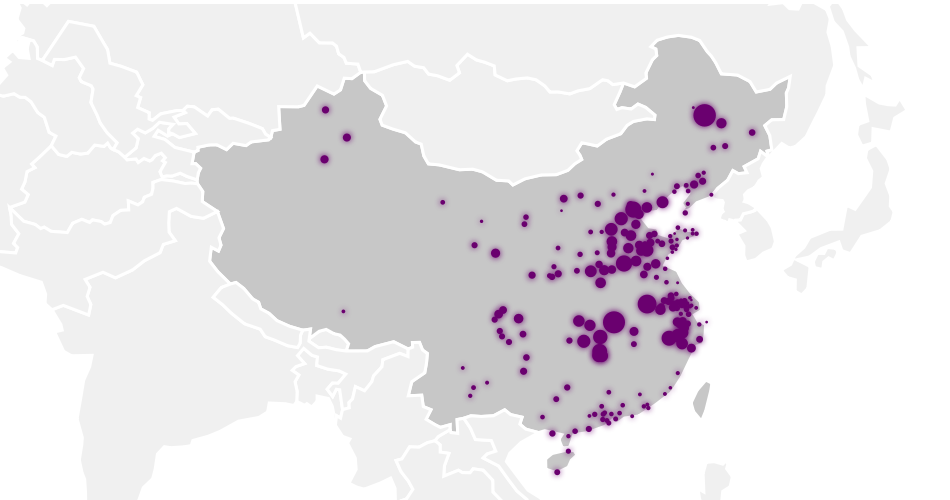
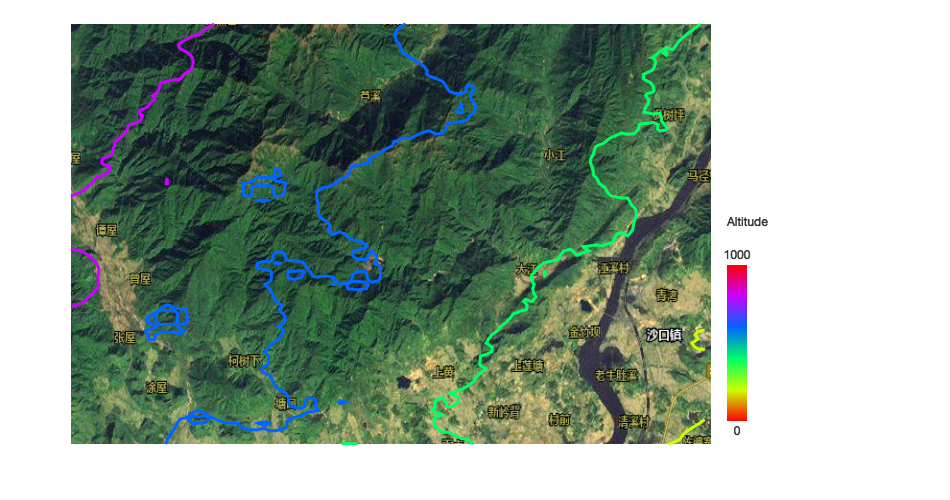
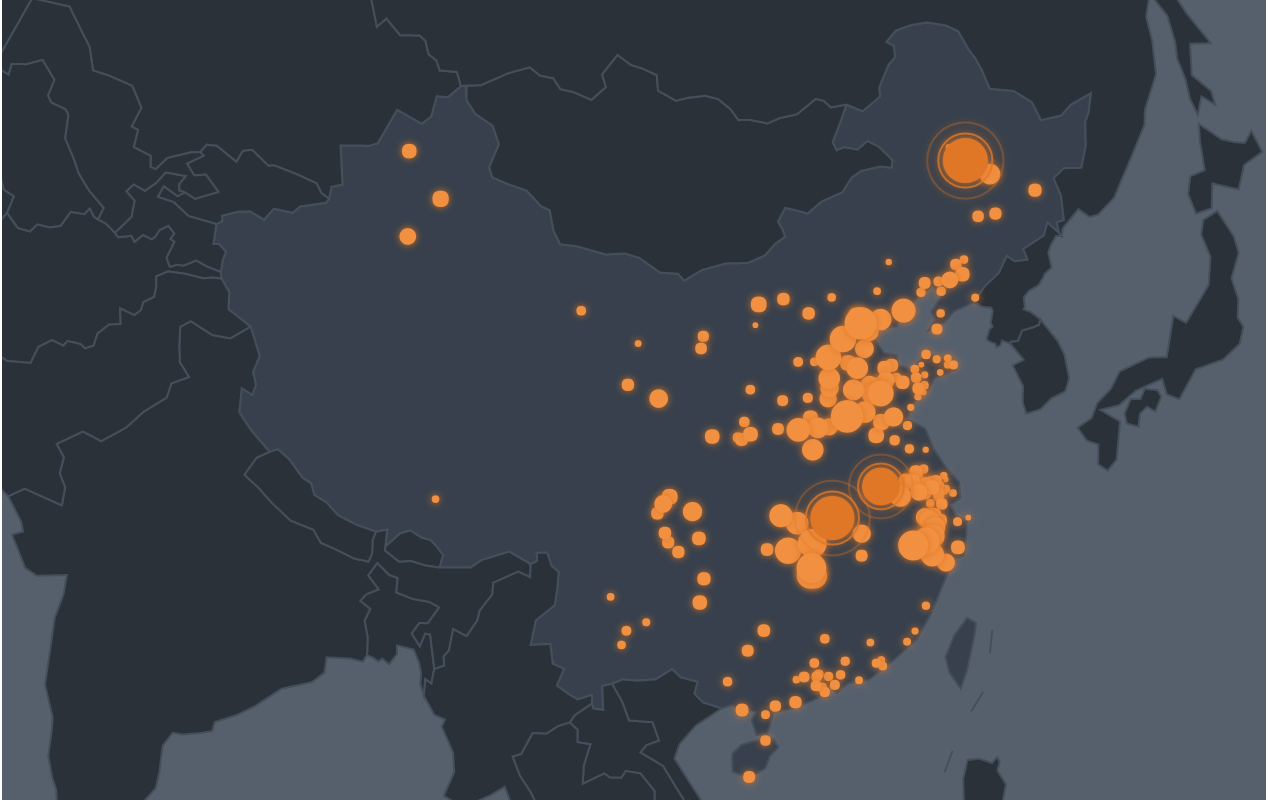
地图
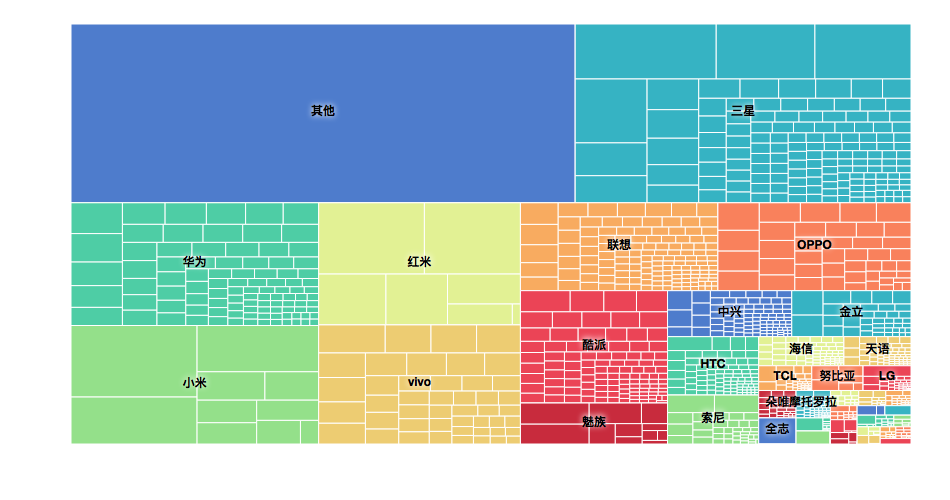
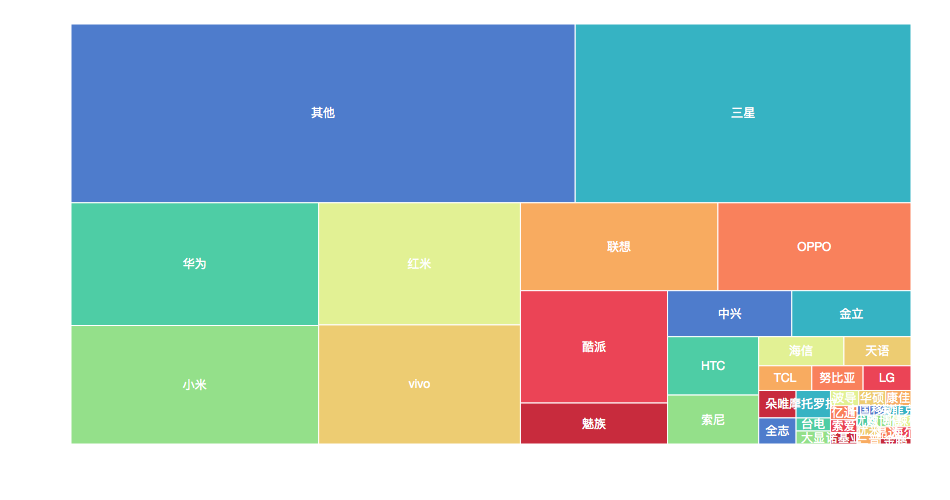
treemap
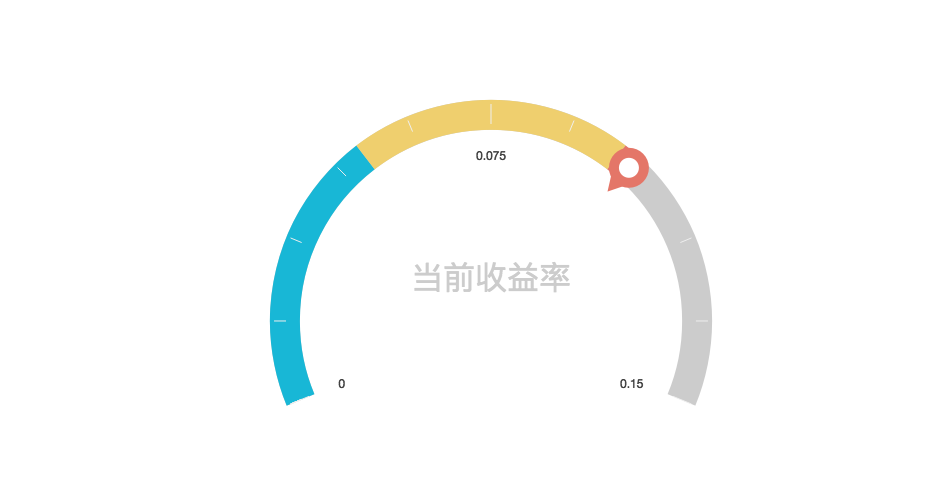
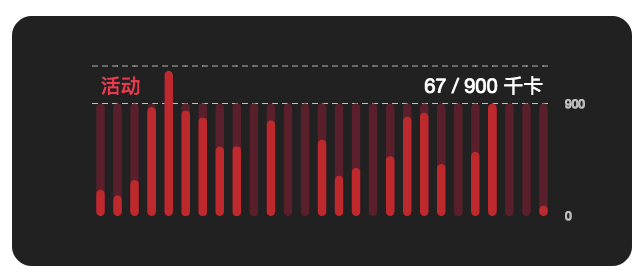
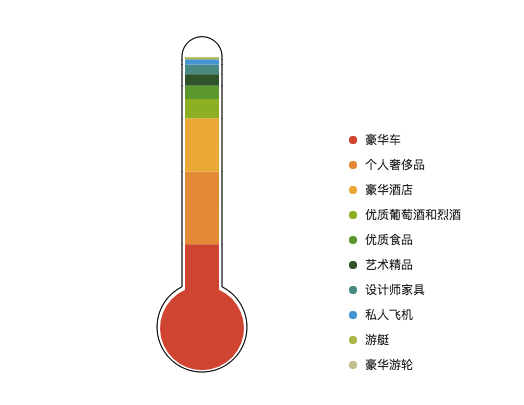
仪表盘
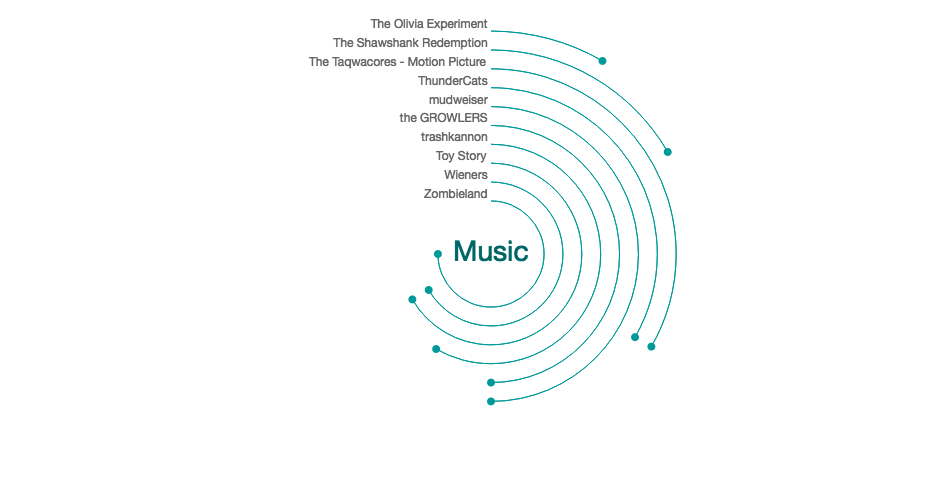
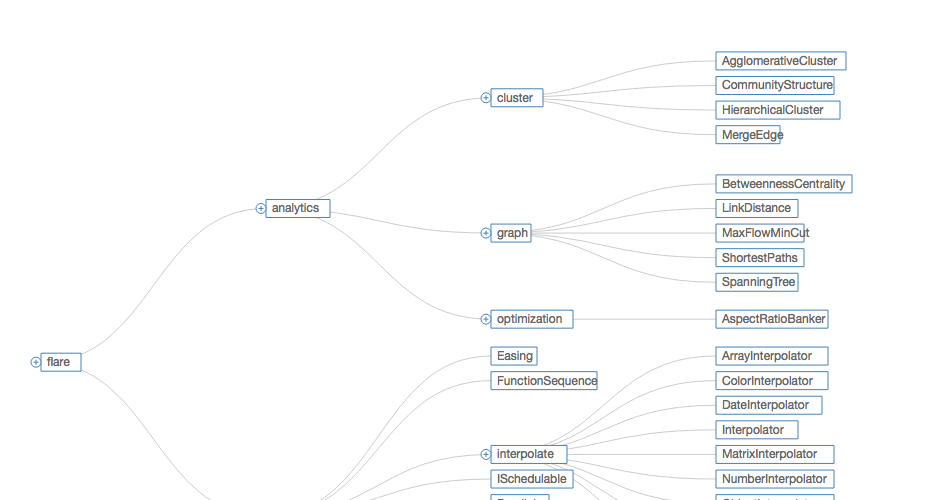
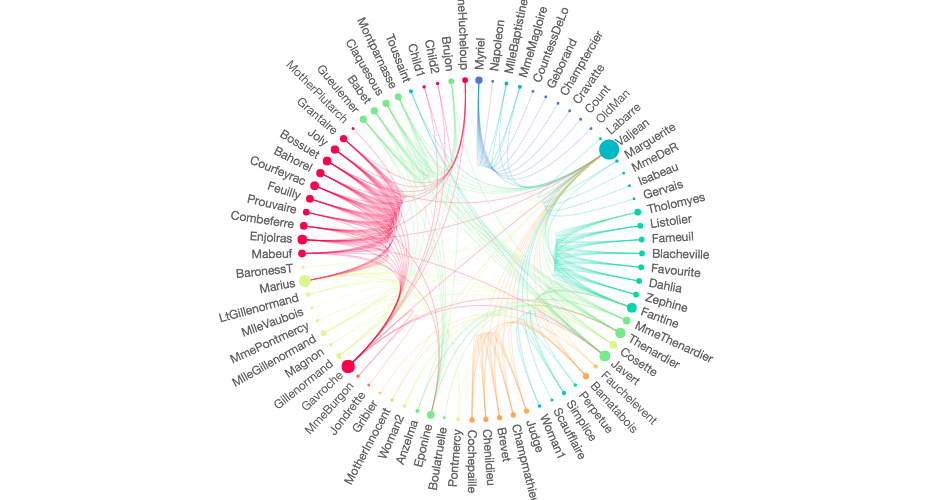
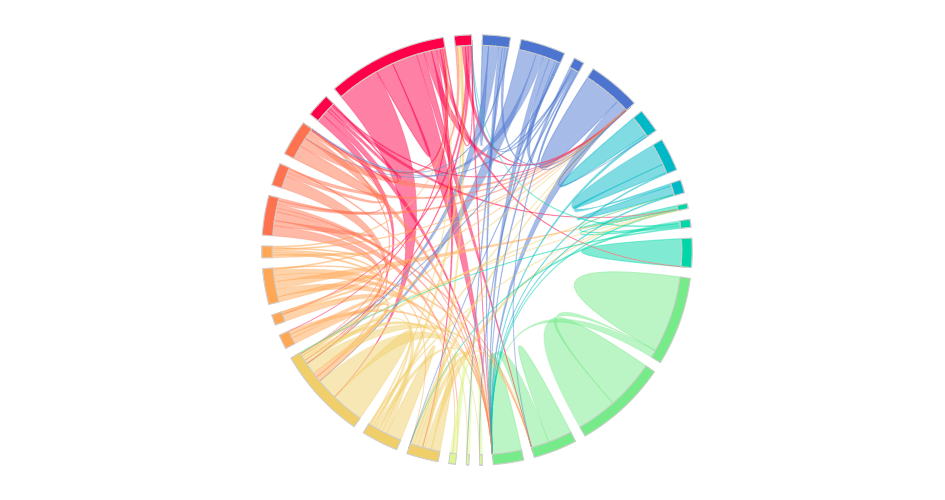
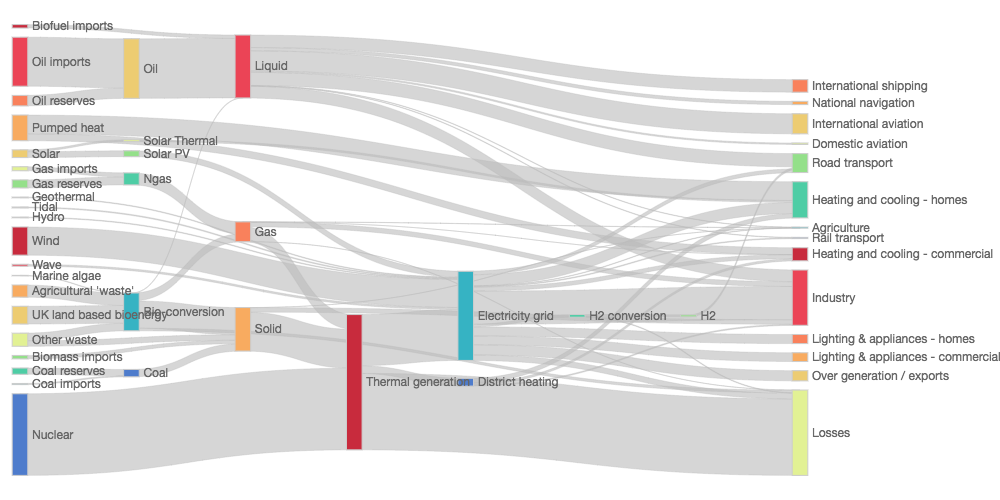
关系图
雷达图
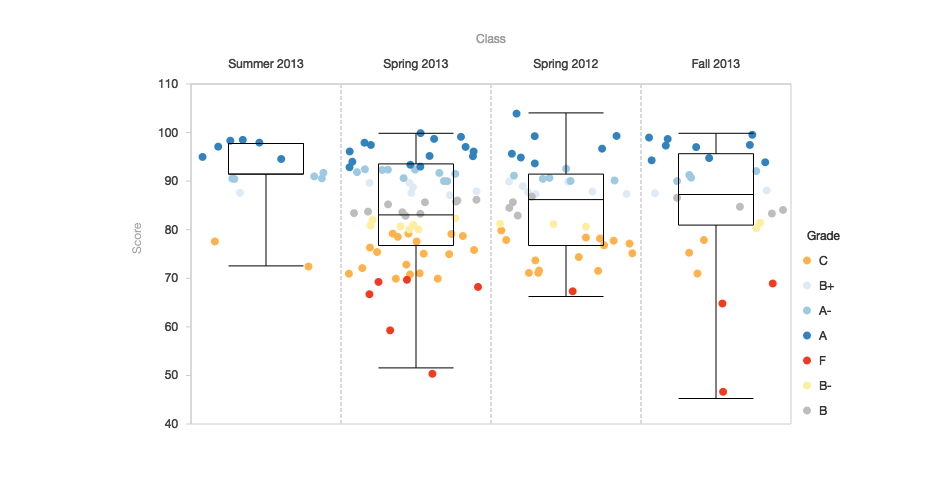
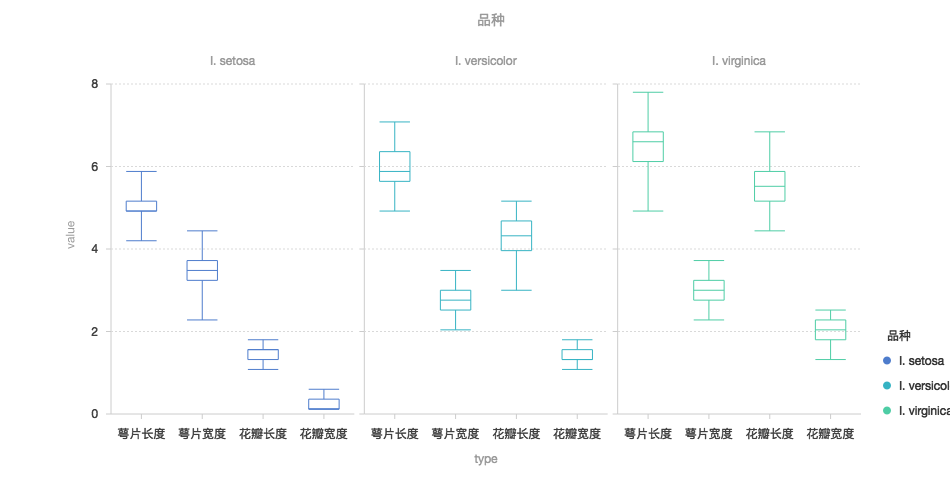
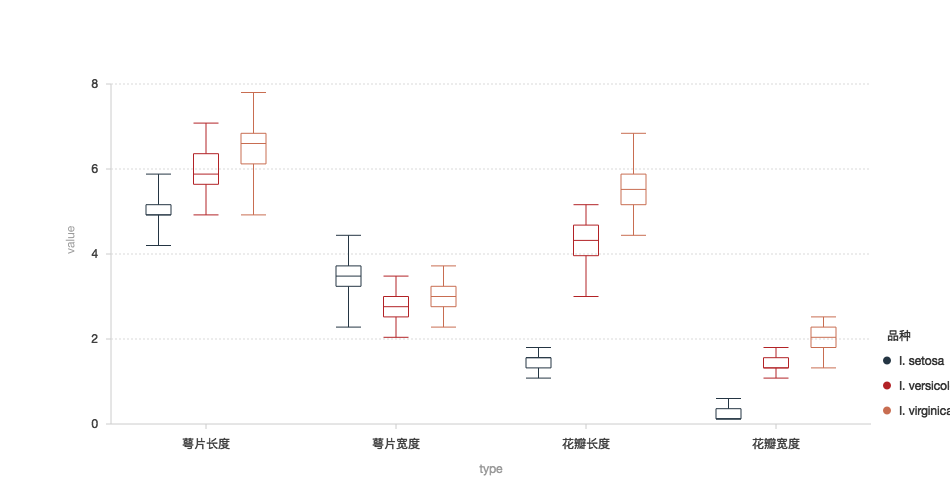
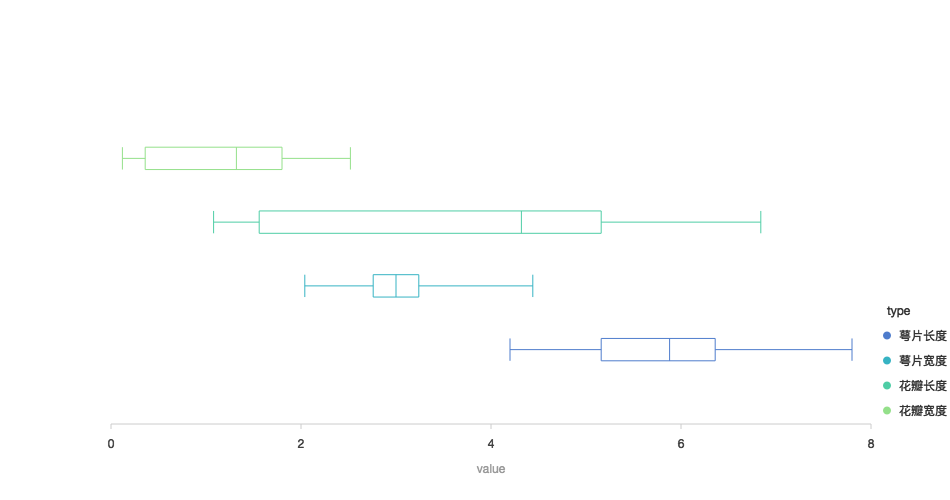
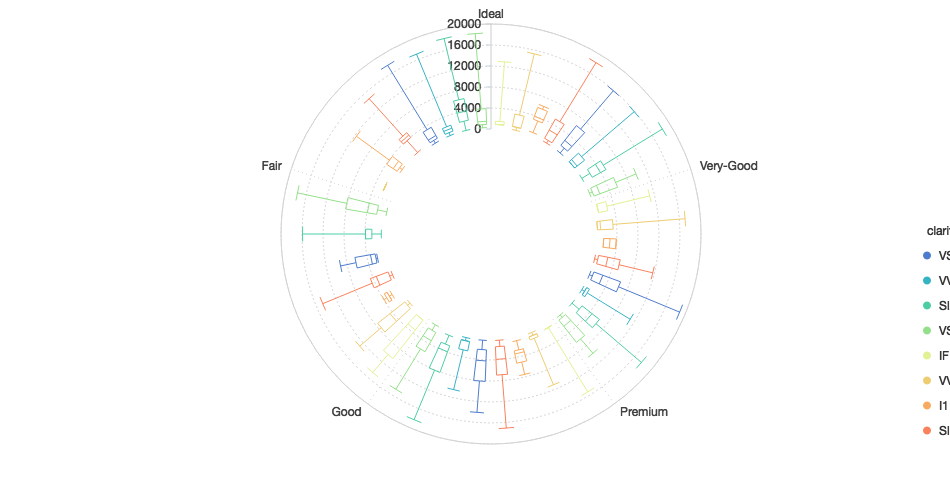
箱型图
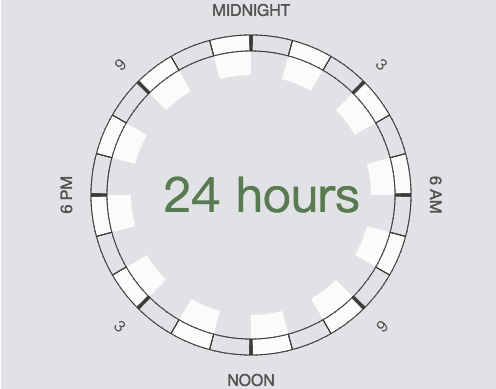
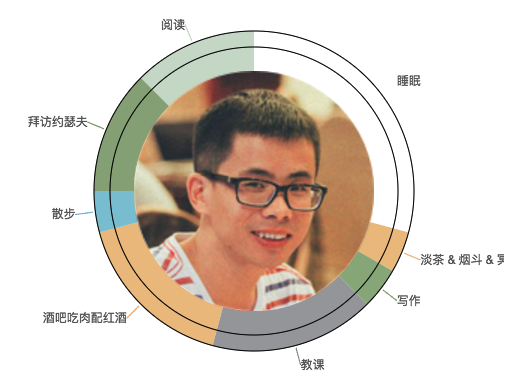
极坐标
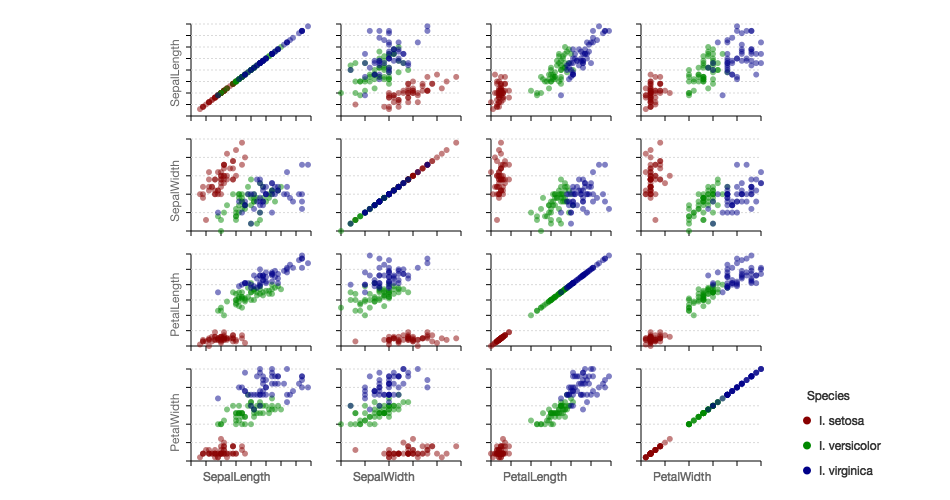
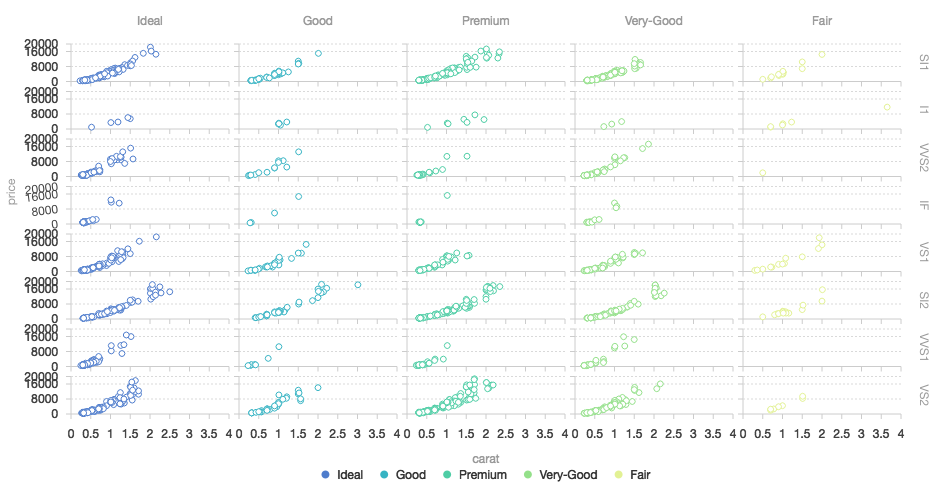
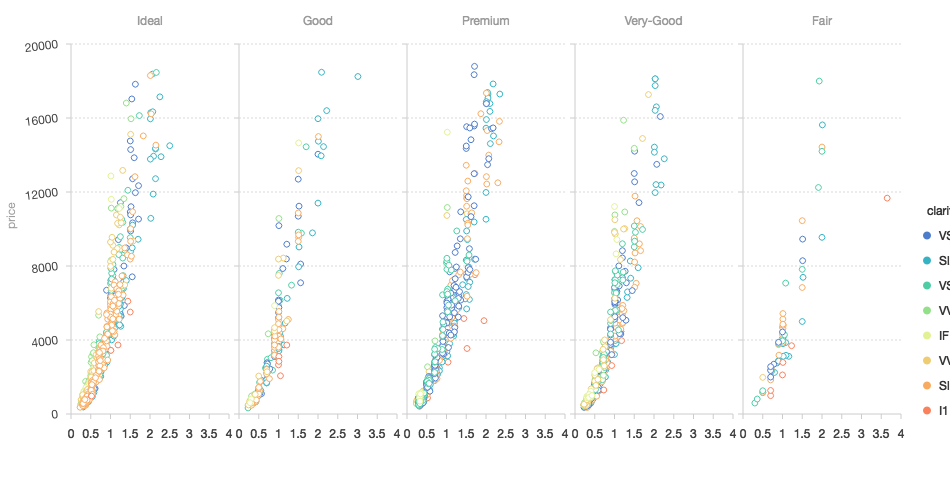
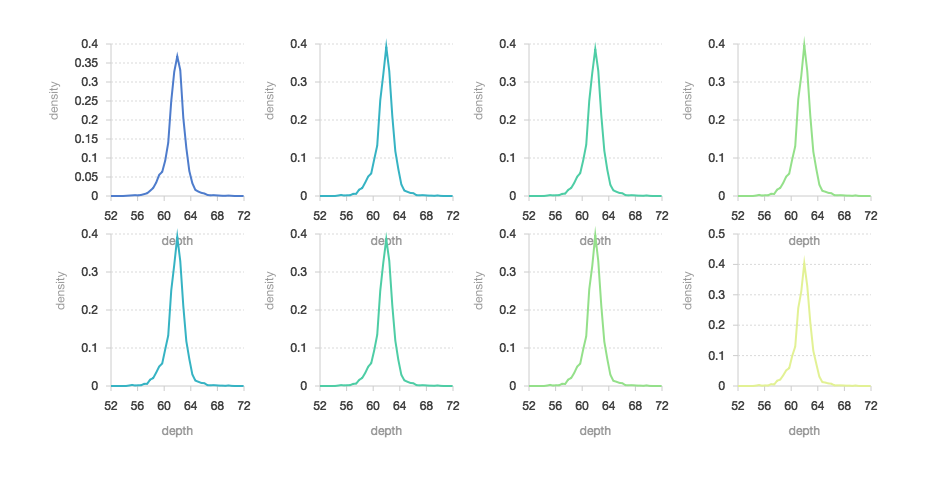
分面
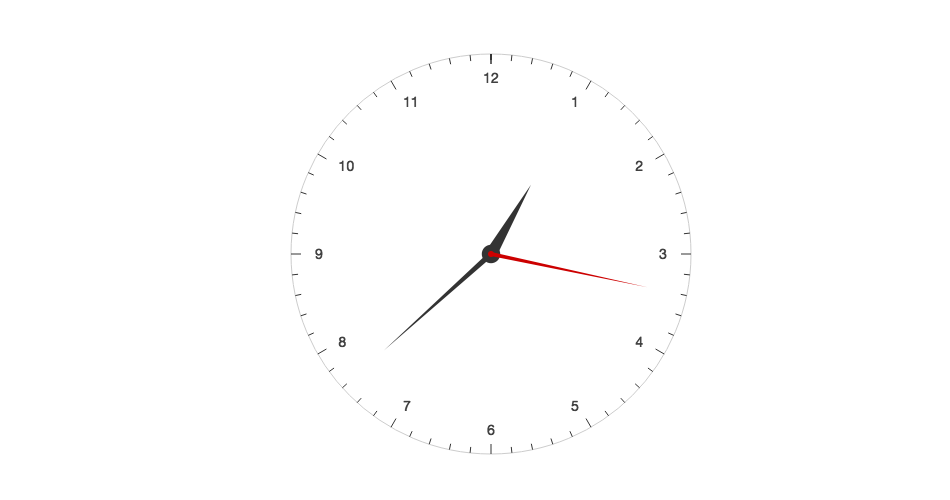
其他图表
gallery
源码
g2-react
运行
复制
<!DOCTYPE html> <html> <head> <meta charset="utf-8"> <title>雷达图(线)</title> <script src="https://a.alipayobjects.com/jquery/jquery/1.11.1/jquery.js"></script> <script src="https://gw.alipayobjects.com/as/g/datavis/g2/2.3.13/index.js"></script> </head> <body> <div id="c1"></div> <script> // 重定义 G2 的全局样式 G2.Global.axis.circle.grid = { line: { stroke: '#d9d9d9', lineWidth: 1, lineDash: [0, 0] } }; var data = [ {name: 'Allocated Budget', Sales: 43000, Marketing: 19000, Development: 60000, 'Customer Support': 35000, 'Information Technology': 17000, Administration: 10000}, {name: 'Actual Spending', Sales: 50000, Marketing: 39000, Development: 42000, 'Customer Support': 31000, 'Information Technology': 26000, Administration: 14000} ]; var chart = new G2.Chart({ id: 'c1', forceFit: true, height: 450, plotCfg: { margin: [20, 140, 80, 80] } }); var Frame = G2.Frame; var frame = new Frame(data); frame = Frame.combinColumns(frame, ['Sales', 'Marketing', 'Development', 'Customer Support', 'Information Technology', 'Administration'], 'value', 'categories', 'name'); chart.source(frame, { 'value': { min: 0, max: 65000, nice: false, tickInterval: 15000 } }); chart.coord('polar'); chart.legend('name', { position: 'bottom' }); chart.axis('categories', { // 设置坐标系栅格样式 line: null }); chart.axis('value',{ line: { lineWidth: 2 }, grid: { line: { lineDash: [0, 0], lineWidth: 1 }, odd: { fill: '#ccc', opacity: 0.3 } // 交替的背景设置,索引值为奇数的 gird }// 设置坐标系栅格样式 }); chart.line().position('categories*value').color('name').size(2); chart.point().position('categories*value').color('name').shape('name', ['square', 'triangle']).size(4); chart.render(); </script> </body> </html>
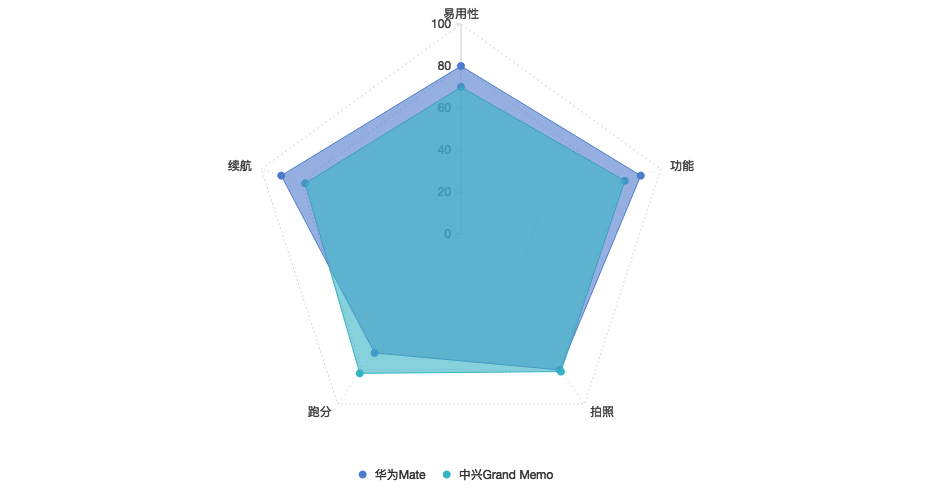
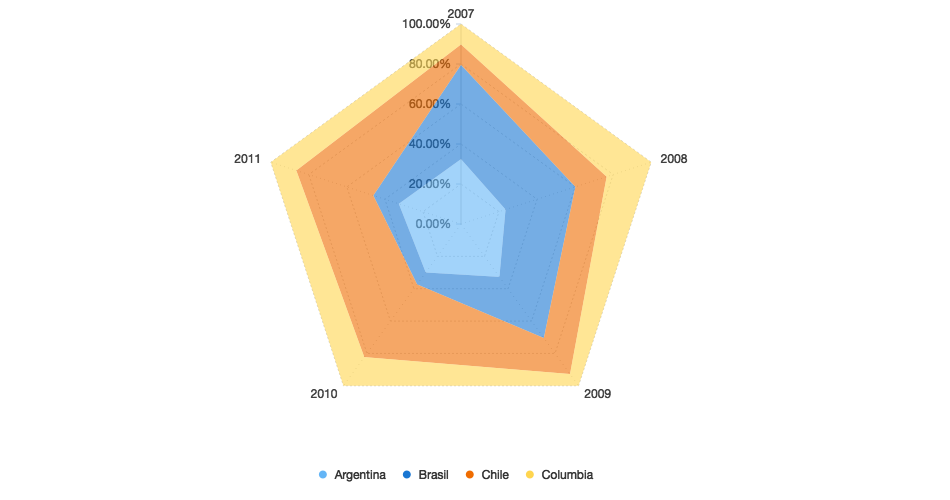
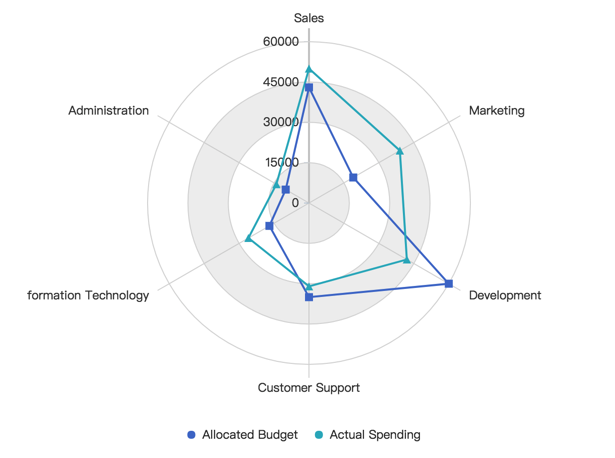
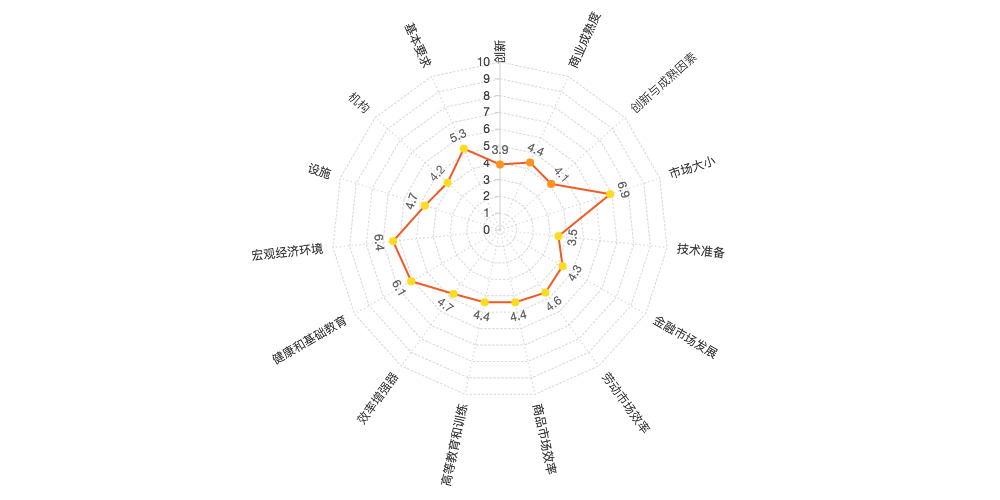
雷达图(线)
雷达又叫戴布拉图、蜘蛛网图。
了解更多
<!DOCTYPE html> <html> <head> <meta charset="utf-8"> <title>雷达图(线)</title> <script src="https://unpkg.com/react@15/dist/react.min.js"></script> <script src="https://unpkg.com/react-dom@15/dist/react-dom.min.js"></script> <script src="https://a.alipayobjects.com/g/datavis/g2/2.3.13/g2.js"></script> <script src="https://unpkg.com/g2-react@1.2.0/dist/index.js"></script> <script src="https://cdn.bootcss.com/babel-core/5.8.38/browser.min.js"></script> <script src="https://unpkg.com/axios/dist/axios.min.js"></script> </head> <body> <div id="c1"></div> <script type="text/babel"> const Chart = createG2(chart => { G2.Global.axis.circle.grid = { line: { stroke: '#d9d9d9', lineWidth: 1, lineDash: [0, 0] } }; chart.col('value', { min: 0, max: 65000, nice: false, tickInterval: 15000 }); chart.coord('polar'); chart.legend('name', { position: 'bottom' }); chart.axis('categories', { // 设置坐标系栅格样式 line: null }); chart.axis('value',{ line: { lineWidth: 2 }, grid: { line: { lineDash: [0, 0], lineWidth: 1 }, odd: { fill: '#ccc', opacity: 0.3 } // 交替的背景设置,索引值为奇数的 gird }// 设置坐标系栅格样式 }); chart.line().position('categories*value').color('name').size(2); chart.point().position('categories*value').color('name').shape('name', ['square', 'triangle']).size(4); chart.render(); }); const MyComponent = React.createClass({ getInitialState() { const data = [ {name: 'Allocated Budget', Sales: 43000, Marketing: 19000, Development: 60000, 'Customer Support': 35000, 'Information Technology': 17000, Administration: 10000}, {name: 'Actual Spending', Sales: 50000, Marketing: 39000, Development: 42000, 'Customer Support': 31000, 'Information Technology': 26000, Administration: 14000} ]; const Frame = G2.Frame; let frame = new Frame(data); frame = Frame.combinColumns(frame, ['Sales', 'Marketing', 'Development', 'Customer Support', 'Information Technology', 'Administration'], 'value', 'categories', 'name'); return { data: frame, forceFit: true, width: 500, height: 450, plotCfg: { margin: [20, 140, 80, 80] } }; }, render() { return ( <div> <Chart data={this.state.data} width={this.state.width} height={this.state.height} plotCfg={this.state.plotCfg} forceFit={this.state.forceFit} /> </div> ); }, }); ReactDOM.render(<MyComponent />, document.getElementById('c1')); </script> </body> </html>